Chapter 10 Environmental hazards-spatial models
This chapter contains the basic theory for spatial processes and a number of approaches to modelling point-referenced spatial data. From this chapter, the reader will have gained an understanding of the following topics:
- Visualization techniques needed for both exploring and analyzing spatial data and communicating its features through the use of maps.
- Exploring the underlying structure of spatial data and methods for characterizing dependence over space.
- Second-order theory for spatial processes including the covariance. The variogram for measuring spatial associations.
- Stationarity and isotropy.
- Methods for spatial prediction, using both classical methods (kriging) as well as modern methods (Bayesian kriging).
- Non-stationarity fields.
Example 10.1 Spatial patterns in lead concentrations in the soil of the Meuse River flood plain
library(geoR)
library(leaflet)
library(sp)

# Load data
data(meuse)
coordinates(meuse)<-~x+y # convert to SPDF

# Assign Netherlands reference system
proj4string(meuse) <- CRS('+init=epsg:28992')

# Convert to longlat reference system
meuse_geo <- spTransform(meuse,CRS("+proj=longlat +datum=WGS84"))
## Warning: PROJ support is provided by the sf and terra packages among othersPlot Figure 10.1 Bubble map
range_values <- range(meuse_df$lead)

# Define bins based on the range of values
mybins <- seq(range_values[1], range_values[2], length.out = 5)

mypalette <- colorBin(palette="inferno", domain=meuse_df$lead,
                      na.color="transparent", bins=mybins)

leaflet( data = meuse_df) |>
  addTiles()  |>
  addProviderTiles("Esri.WorldImagery")  |>
  addCircleMarkers(
    ~ x,
    ~ y,
    fillOpacity = 0.8, color="orange",
    fillColor = ~ mypalette(lead),
    opacity = 5,
    radius = ~lead/50,
    stroke = FALSE) |>
  addLegend( pal=mypalette, values=~lead,
             opacity=0.9, title = "Lead", position = "bottomright" )
meuse_geodata <- as.geodata(as.data.frame(meuse), coords.col = 1:2, data.col = 5)
plot(meuse_geodata)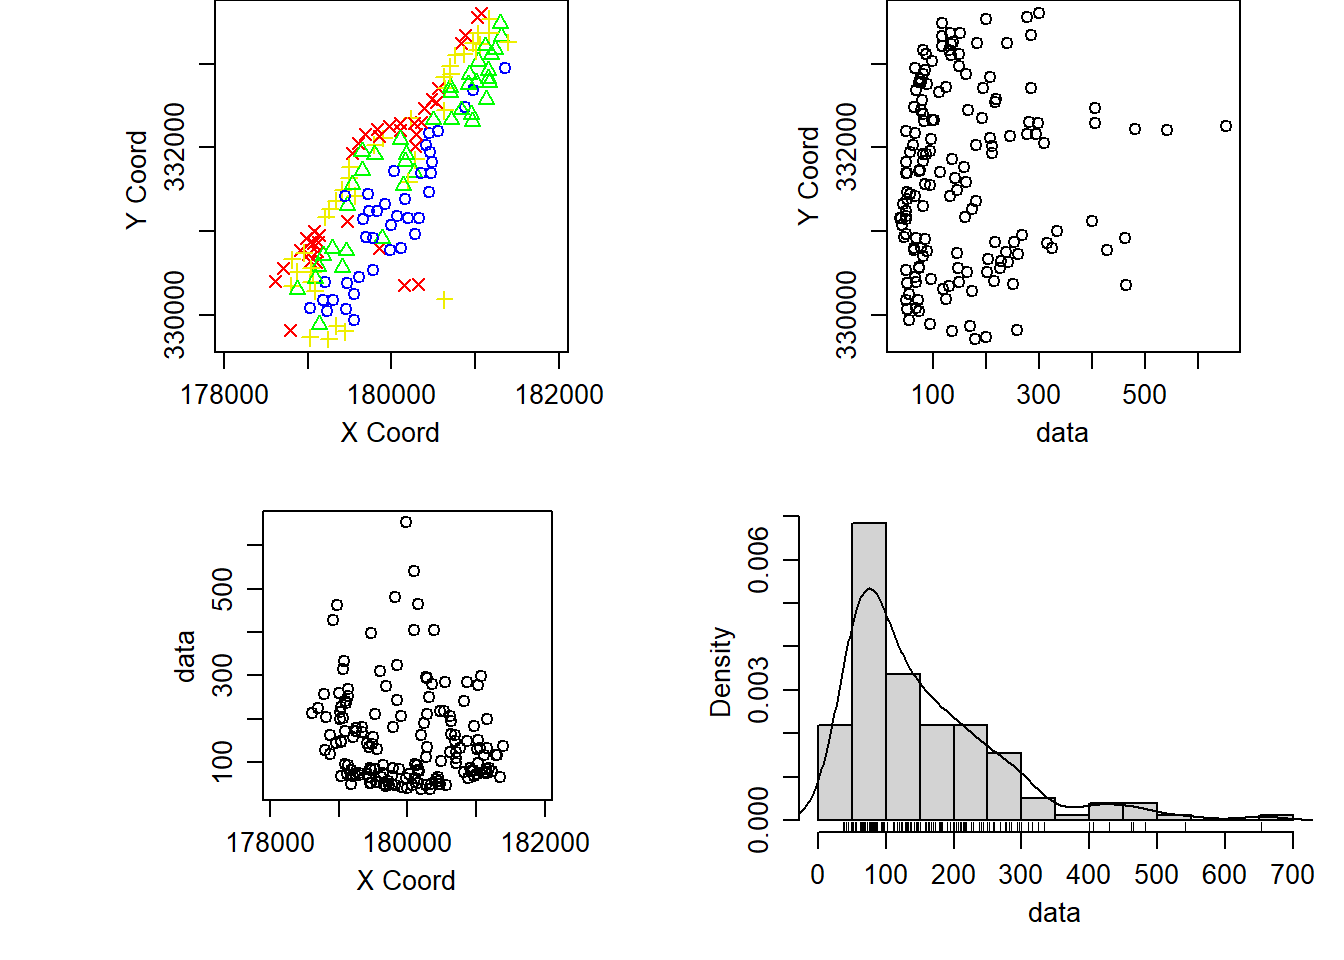
Example 10.2: Examining the log concentrations of lead in the Meuse River flood plain
par(mfrow = c(1, 2))
log_histogram <-
  hist(log(meuse$lead), main = "", xlab = "log(lead)")
qqnorm(log(meuse$lead), bty = "n")
qqline(log(meuse$lead))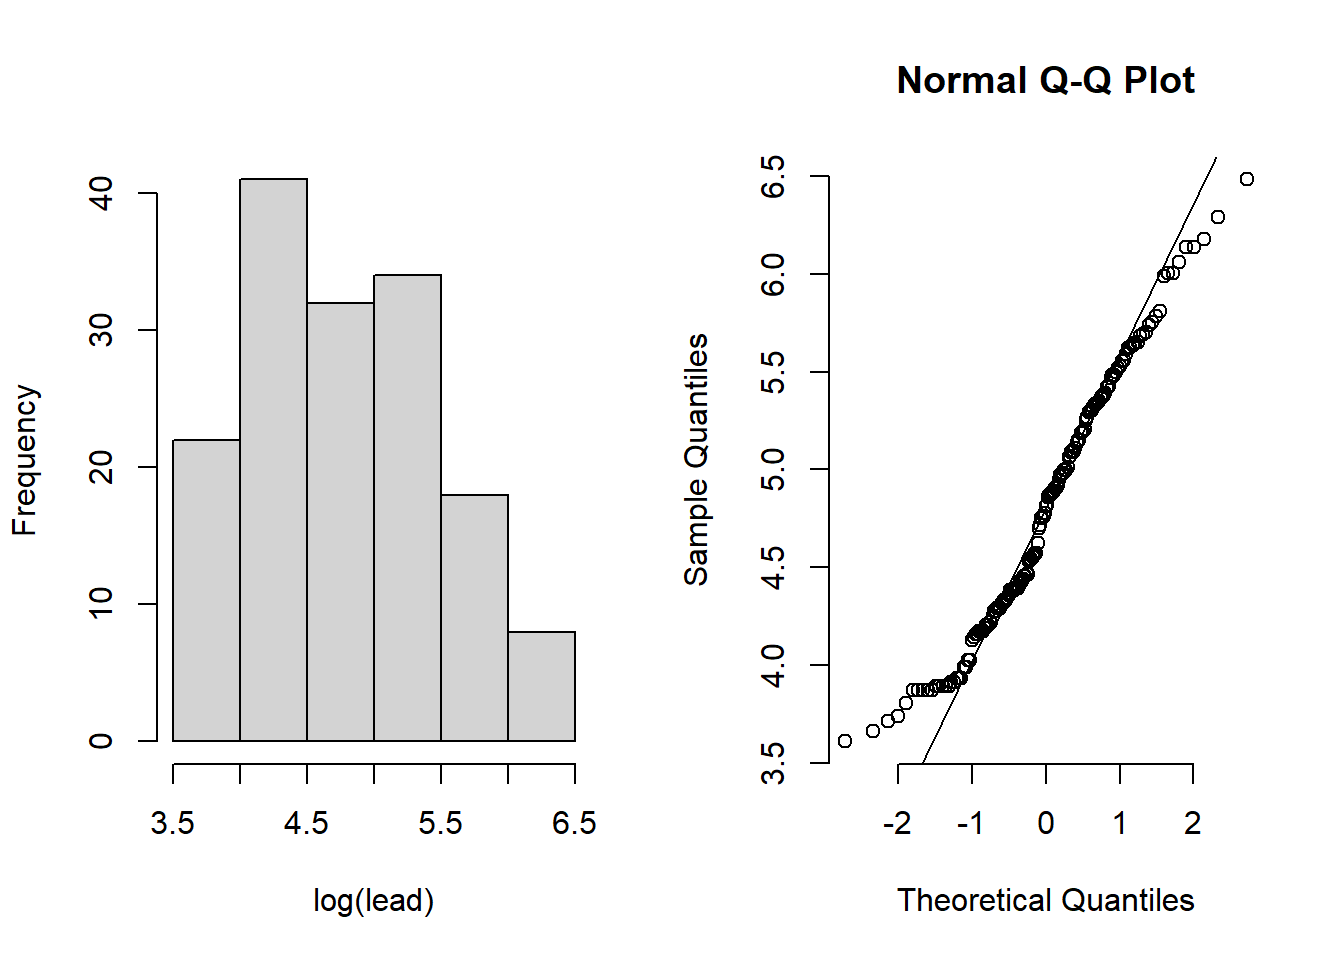
Example 10.3: Mapping the locations of ozone monitoring sites in New York State
This example uses the coordinates in the NY_metadata.txt file.
# Load the metadata giving the site coordinates
ny_data <- read.csv("data/ozone/NY_metadata.txt", sep = "")
# Now copy ny_data into ny_data_sp and convert data to "sp" format
ny_data_sp <- ny_data
coordinates(ny_data_sp) <- ~ Longitude + Latitude

# assign a reference system to ny_data_sp
proj4string(ny_data_sp) <- CRS("+proj=longlat +ellps=WGS84")


leaflet( data = ny_data) |>
  addTiles()  |>
  addProviderTiles("Esri.WorldImagery")  |>
  addCircleMarkers(
    ~ Longitude,
    ~ Latitude,
    fillOpacity = 0.8, color="orange",
    opacity = 5,
    radius = 4,
    stroke = FALSE)
Example 10.5: Spatial prediction of temperatures in California
# REVIEW: There is something wrong with this dataset, it is impossible to have this temperatures
# most likely all the data has to be divided by 10

library(geoR)
library(gstat)
library(sp)

### First we load the data
CAmetadata <- read.table("data/metadataCA.txt", header = TRUE)
CATemp <- read.csv("data/MaxCaliforniaTemp.csv", header = TRUE)
CATemp_20120901 <- CATemp[CATemp$X == 20120901, -c(1,14)]
CATemp_20120901 <- t(CATemp_20120901)
### Change names of lat, long
names(CAmetadata)[names(CAmetadata)=="Long"]<-"x"
names(CAmetadata)[names(CAmetadata)=="Lat"]<-"y"

### Augment data file with coordinates
CATemp_20120901 <- cbind(CAmetadata, CATemp_20120901/10)
names(CATemp_20120901)[names(CATemp_20120901) == "245"] <- "Temp"
coordinates(CATemp_20120901) <- ~x +y

CAgstat.vario <- variogram(Temp ~ x+y, CATemp_20120901)
#CAgstat.vario <- variogram(Temp ~ 1, CATemp_20120501, print.SSE = TRUE)

CATemp.variofit <- fit.variogram(CAgstat.vario,
vgm(10, "Exp", 1, 0.1))

# Plot variogram and fit

plot(CAgstat.vario, CATemp.variofit, bty = "n")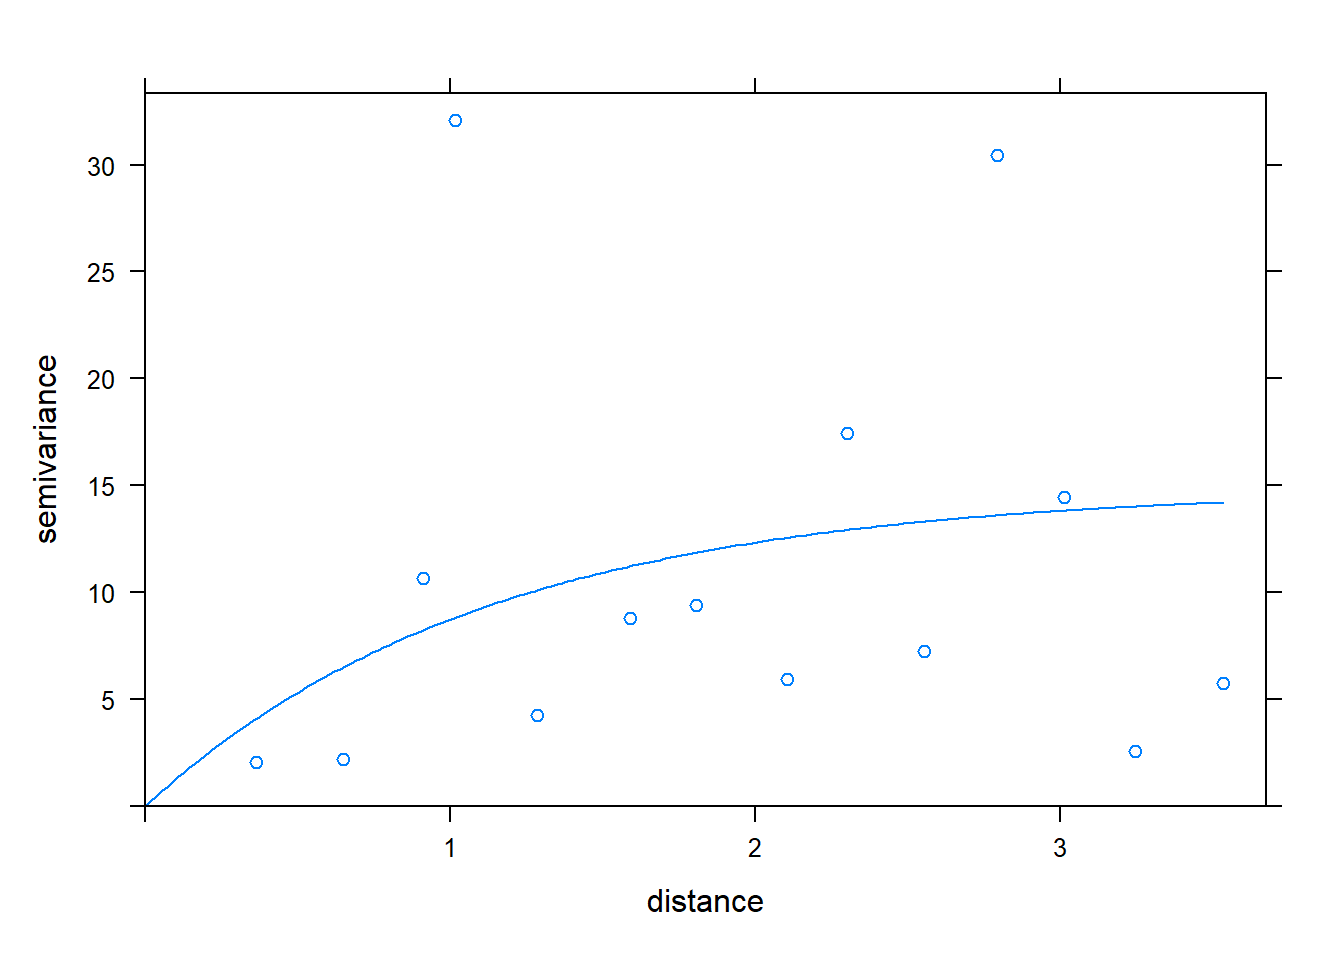
##      model       psill            range            kappa            ang1
##  Nug    :1   Min.   : 0.000   Min.   :0.0000   Min.   :0.000   Min.   :0
##  Exp    :1   1st Qu.: 3.713   1st Qu.:0.2813   1st Qu.:0.125   1st Qu.:0
##  Sph    :0   Median : 7.425   Median :0.5627   Median :0.250   Median :0
##  Gau    :0   Mean   : 7.425   Mean   :0.5627   Mean   :0.250   Mean   :0
##  Exc    :0   3rd Qu.:11.138   3rd Qu.:0.8440   3rd Qu.:0.375   3rd Qu.:0
##  Mat    :0   Max.   :14.851   Max.   :1.1254   Max.   :0.500   Max.   :0
##  (Other):0
##       ang2        ang3       anis1       anis2
##  Min.   :0   Min.   :0   Min.   :1   Min.   :1
##  1st Qu.:0   1st Qu.:0   1st Qu.:1   1st Qu.:1
##  Median :0   Median :0   Median :1   Median :1
##  Mean   :0   Mean   :0   Mean   :1   Mean   :1
##  3rd Qu.:0   3rd Qu.:0   3rd Qu.:1   3rd Qu.:1
##  Max.   :0   Max.   :0   Max.   :1   Max.   :1
##
# Create the grid on which to make the spatial predictions
CAPred.loci <- expand.grid(seq(-125, -115, 0.1), seq(32, 42, 0.1))
names(CAPred.loci)[names(CAPred.loci) == "Var1"] <- "x"
names(CAPred.loci)[names(CAPred.loci) == "Var2"] <- "y"
coordinates(CAPred.loci) = ~ x + y
gridded(CAPred.loci) = TRUE
mod <- vgm(14, "Exp", 1.1, 0.01)
# Get the monitoring locations
monitor_loc <- list('sp.points', CATemp_20120901, pch=19, cex=.8, col='cornsilk4')
# ordinary kriging:
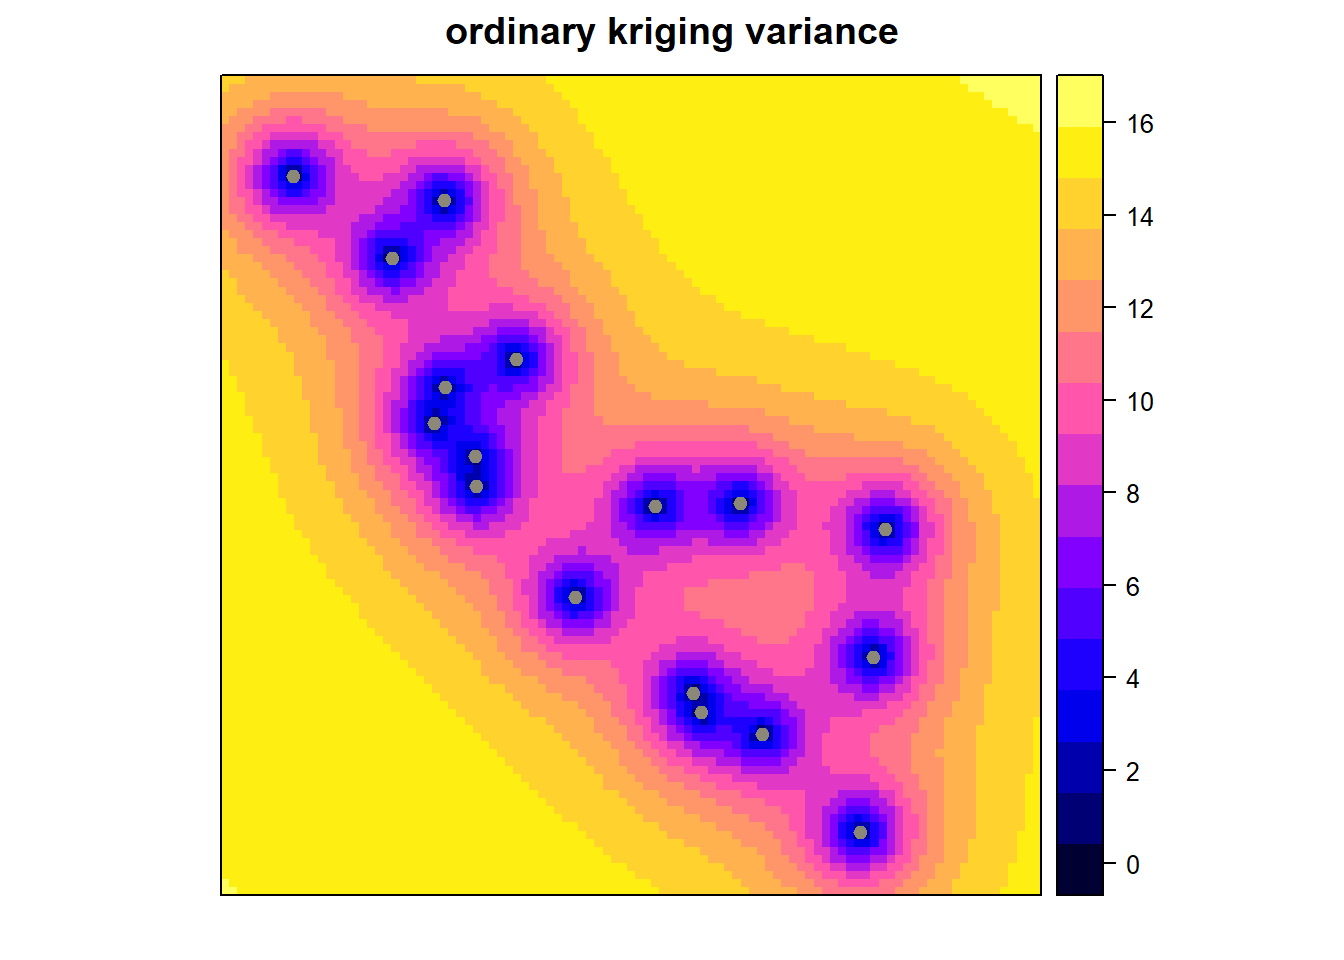
x <- krige(Temp ~ 1, CATemp_20120901, CAPred.loci, model = mod)## [using ordinary kriging]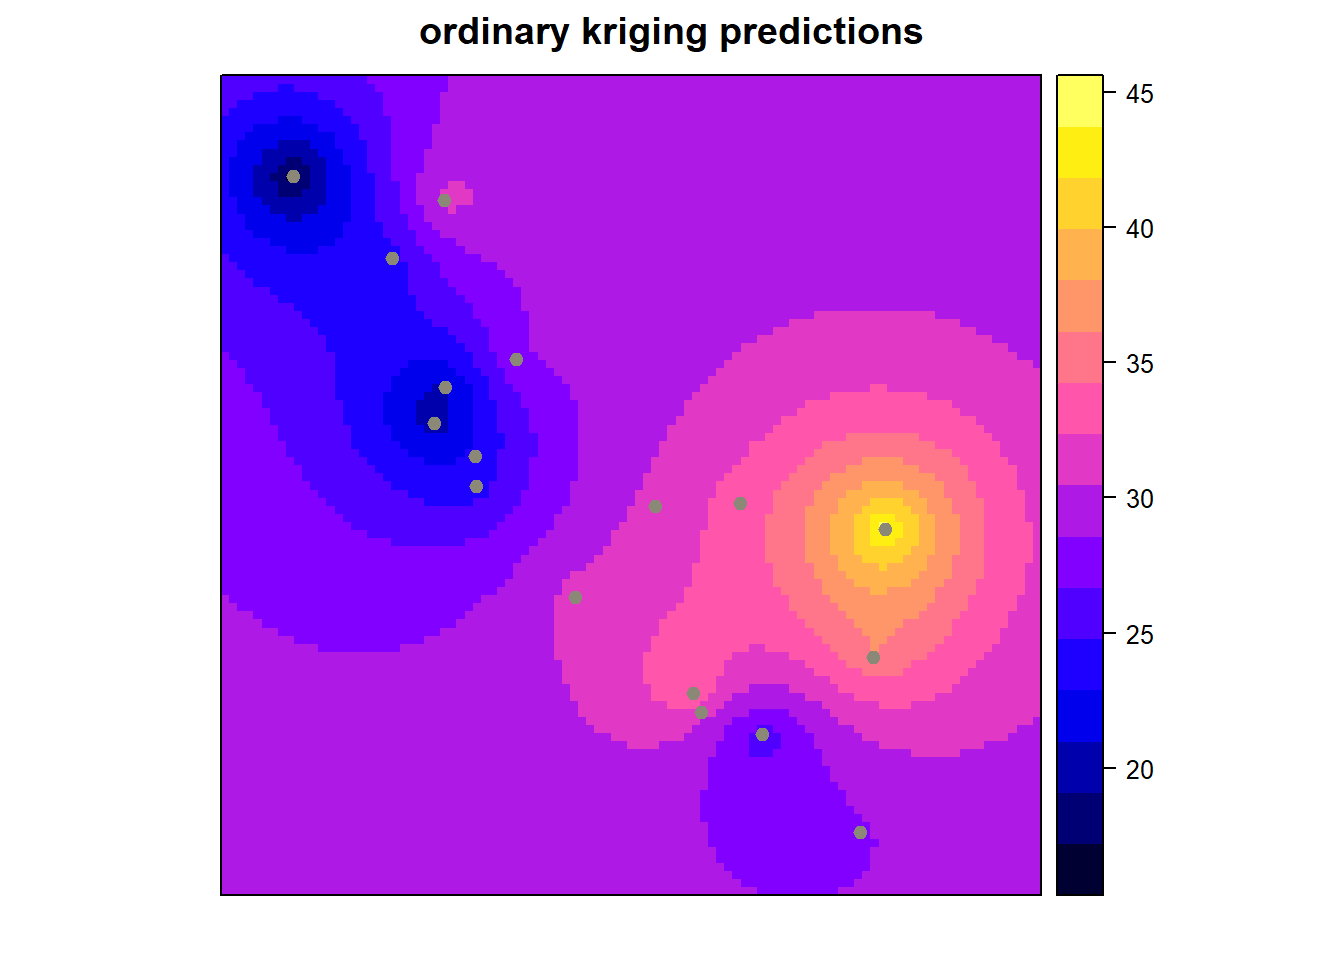
Example 10.7 Spatial prediction of \(PM_{2.5}\) in Europe
library(gdata)
library(leaflet)
library(gstat)
library(nimble)
library(sp)
library(tidybayes)
library(tidyverse)

ditch_the_axes <- theme(
  axis.text = element_blank(),
  axis.line = element_blank(),
  axis.ticks = element_blank(),
  panel.border = element_blank(),
  panel.grid = element_blank(),
  axis.title = element_blank())

#perl <- "C:/Perl64/bin/perl5.28.1.exe" # add location of perl exe for read.xls
perl <- ("C:/Strawberry/perl/bin/perl5.32.1.exe")
no2 <- read.xls("data/no2_europe/NO2Europe.xlsx", perl = perl)
no2$AirPollutionLevel <- as.numeric(no2$AirPollutionLevel)
colnames(no2)
## [1] "Country" "CountryCode"
## [3] "City" "AirQualityNetwork"
## [5] "AirQualityNetworkName" "AirQualityStation"
## [7] "AirQualityStationEoICode" "AQStationName"
## [9] "AirPollutant" "AirPollutantCode"
## [11] "DataAggregationProcess" "YearOfStatistics"
## [13] "AirPollutionLevel" "UnitOfAirpollutionLevel"
## [15] "DataCoverage" "Verification"
## [17] "AirQualityStationType" "AirQualityStationArea"
## [19] "Longitude" "Latitude"
## [21] "Altitude" "CountryName"
## [23] "CountryType" "DataAggregationProcess_original"
## [25] "AirPollutantCode_original" "AirPollutant_original"
## [27] "cut"summary_no2 <- group_by(no2, Country) |>
summarize(total = n(),
mean_country = mean(AirPollutionLevel, na.rm = TRUE)) |> as.data.frame()
summary_no2[order(summary_no2$total, decreasing = TRUE),]## Country total mean_country
## 30 Spain 465 15.544086
## 12 Germany 396 21.464646
## 11 France 330 18.215152
## 17 Italy 280 21.771429
## 33 United Kingdom 153 22.581699
## 25 Poland 147 16.319728
## 2 Austria 141 18.787234
## 3 Belgium 70 19.571429
## 7 Czechia 63 16.761905
## 26 Portugal 45 18.044444
## 24 Norway 40 22.625000
## 22 Netherlands 39 18.564103
## 32 Switzerland 32 21.312500
## 31 Sweden 29 19.793103
## 28 Slovakia 25 17.600000
## 10 Finland 23 11.173913
## 4 Bulgaria 20 20.650000
## 14 Hungary 19 22.052632
## 19 Lithuania 14 15.142857
## 5 Croatia 12 17.250000
## 16 Ireland 11 15.818182
## 8 Denmark 10 14.600000
## 23 North Macedonia 10 18.600000
## 9 Estonia 9 7.111111
## 15 Iceland 9 5.888889
## 29 Slovenia 9 18.777778
## 13 Greece 8 30.375000
## 20 Luxembourg 6 18.000000
## 27 Serbia 5 21.200000
## 6 Cyprus 3 19.666667
## 18 Latvia 3 22.000000
## 1 Andorra 1 31.000000
## 21 Malta 1 3.000000mypalette <- colorFactor(palette="inferno", domain=no2$Country)
leaflet( data = no2) |>
addTiles() |>
addProviderTiles("Esri.WorldImagery") |>
addCircleMarkers(
~ Longitude,
~ Latitude,
color = ~ mypalette(Country) ,
fillOpacity = 0.8,
opacity = 5,
radius = 2,
stroke = FALSE) set.seed(321)
no2_sample <- no2 |>
filter(Longitude < 30 & Longitude > -25 & Latitude > 30 & Latitude < 70)
no2_sample <- no2_sample |>
filter(Country == "Spain" | Country == "Germany" | Country == "France" |
Country == "Italy" | Country == "United Kingdom" |
Country == "Poland" | Country == "Austria" )
no2_subsample <- no2_sample |> group_by(Country) |> slice_sample(n = 128)
dim(no2_subsample)## [1] 896 27mypalette <- colorFactor(palette="inferno", domain=no2_subsample$Country)
leaflet( data = no2_subsample) |>
addTiles() |>
addProviderTiles("Esri.WorldImagery") |>
addCircleMarkers(
~ Longitude,
~ Latitude,
color = ~ mypalette(Country) ,
fillOpacity = 0.8,
opacity = 5,
radius = 2,
stroke = FALSE) # Function to get utm coordinates since we have different utm zones
# This function was obtained from: https://stackoverflow.com/questions/71573206/converting-latitude-and-longitude-data-to-utm-with-points-from-multiple-utm-zone
get_utm <- function(x, y, zone, loc){
points = SpatialPoints(cbind(x, y),
proj4string = CRS("+proj=longlat +datum=WGS84"))
points_utm = spTransform(points,
CRS(paste0("+proj=utm +zone=",
zone[1]," +ellps=WGS84")))
if (loc == "x") {
return(coordinates(points_utm)[,1])
} else if (loc == "y") {
return(coordinates(points_utm)[,2])
}
}
no2_utm <- rename(no2_subsample, x = Longitude, y = Latitude)
no2_utm <-
mutate(no2_utm, zone2 = (floor((x + 180)/6) %% 60) + 1, keep = "all") |>
group_by(zone2) |>
mutate(utm_x = get_utm(x, y, zone2, loc = "x"),
utm_y = get_utm(x, y, zone2, loc = "y"))|> as.data.frame() |>
dplyr::select(utm_x, utm_y, Altitude, Country, AirPollutionLevel) |>
mutate( ID = c(1:896))
no2_utm_geo <- no2_utm
# change coordinates to kms and turn into a Spatial object
no2_utm_geo[,c("utm_x", "utm_y")] <- no2_utm_geo[,c("utm_x", "utm_y")]/1000
coordinates(no2_utm_geo) <- ~ utm_x + utm_y# Estimate variogram intercept only
no2_inter_vgm <- variogram(log(AirPollutionLevel) ~ 1,
data = no2_utm_geo,
cutoff = 200,# cutoff distance
width = 200 / 10) # bins width
no2_vgm_inter_fit <- fit.variogram(no2_inter_vgm,
model = vgm(0.8, "Exp", 15, 0.007))
no2_vgm_inter_fit## model psill range
## 1 Nug 0.1260258 0.00000
## 2 Exp 0.2119263 28.07435# Estimate variogram with coordinates and altitude
no2_utm_vgm <- variogram(log(AirPollutionLevel) ~ utm_x + utm_y + Altitude,
data = no2_utm_geo,
cutoff = 200,# cutoff distance
width = 200 / 10) # bins width
no2_vgm_fit <- fit.variogram(no2_utm_vgm,
model = vgm(0.8, "Exp", 15, 0.007))
no2_vgm_fit## model psill range
## 1 Nug 0.1350376 0.00000
## 2 Exp 0.1667001 36.06112plot_inter_variog <- plot(no2_inter_vgm, no2_vgm_inter_fit,
ylim=c(0,0.4), bty = "n")
plot_coord_variog <- plot(no2_utm_vgm, no2_vgm_fit, ylim=c(0,0.4), bty = "n")
cowplot::plot_grid(plot_inter_variog, plot_coord_variog, labels = "auto")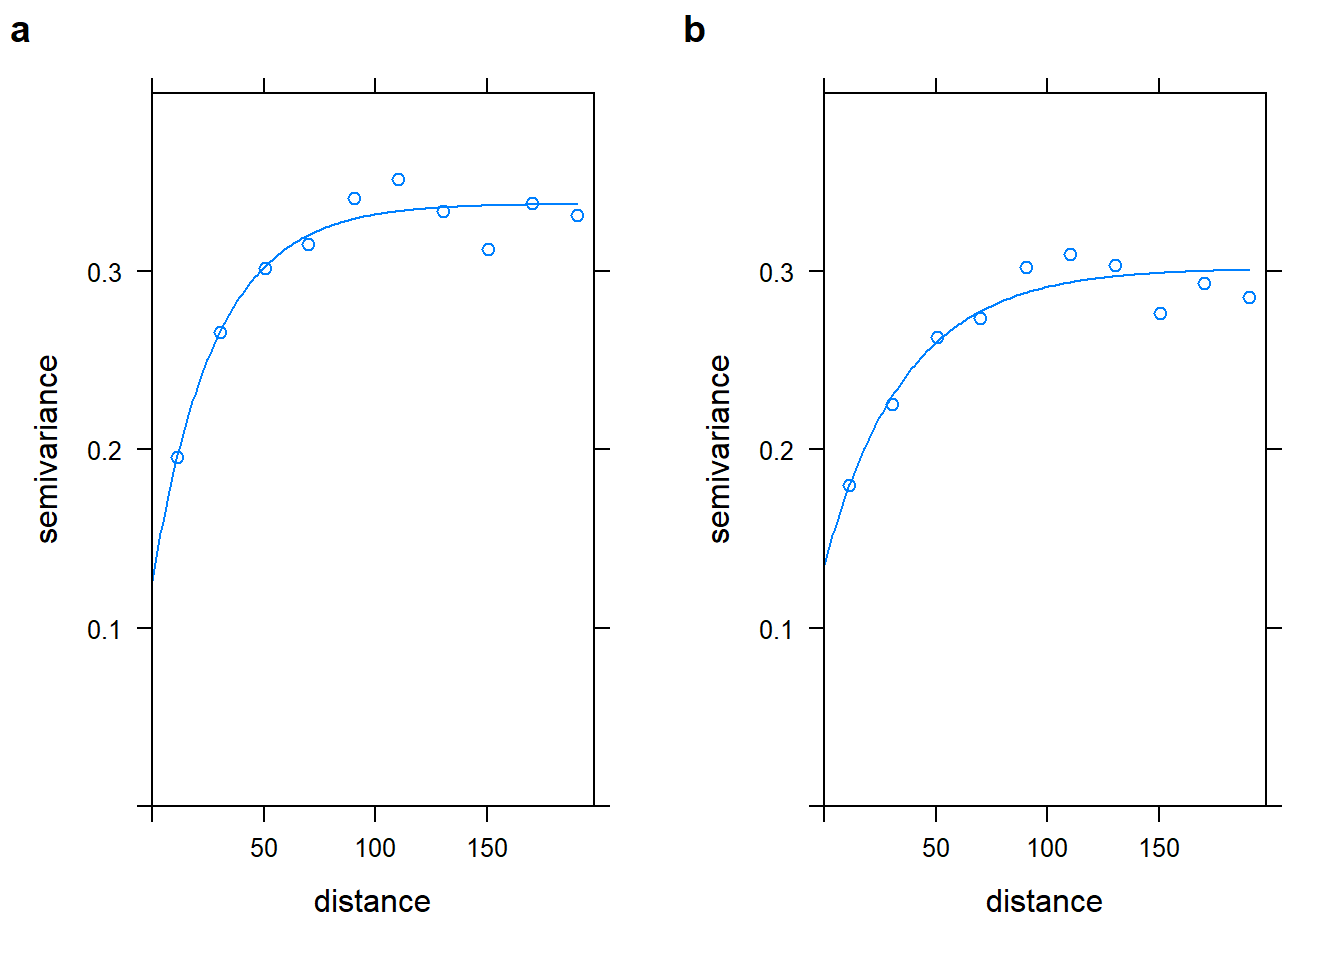
# Change coordinates to kilometers and observations to the log scale
no2_df <-
  data.frame(
    y = log(no2_utm$AirPollutionLevel),
    easting =  no2_utm$utm_x / 1000,
    northing = no2_utm$utm_y / 1000,
    altitude = no2_utm$Altitude
  )
# Compute the distance matrix
obsCoords <- unname(as.matrix(no2_df[,c("easting", "northing")]))

obsDist <- fields::rdist(obsCoords)

easting_scaled <- as.vector(scale(no2_df$easting))
northing_scaled <- as.vector(scale(no2_df$northing))
altitude_scaled <- as.vector(scale(no2_df$altitude))
WARNING
Due to the number of locations this model can take a long time to run in a regular computer (more than 3 hours)
NO2Code <-  nimbleCode ({
  # Covariance matrix spatial effect
  Sigma[1:n, 1:n] <-
    sigma_sq * exp(-distMatrix[1:n, 1:n] / phi) + tau_sq * identityMatrix(d = n)

    for (site in 1:n) {
    mean.site[site] <-
      beta0 + beta1 * easting[site] + beta2 * northing[site] + beta3 * altitude[site]
  }
  y[1:n]  ~  dmnorm(mean.site[1:n], cov = Sigma[1:n, 1:n])
  # Set up the priors for the spatial model
  sigma ~ T(dt(mu = 0, sigma = 1, df = 1), 0, Inf)
  sigma_sq <- sigma^2
  tau ~ T(dt(mu = 0, sigma = 1, df = 1), 0, Inf)
  tau_sq <- tau^2
  phi_inv ~ dgamma(shape =  5, rate = 5)
  phi <- 1 / phi_inv
  # prior for the coefficients
  beta0 ~ dnorm (0, 10)
  beta1 ~ dnorm (0, 10)
  beta2 ~ dnorm (0, 10)
  beta3 ~ dnorm (0, 10)

})

# Define the constants, data, parameters and initial values
set.seed(1)

constants <-
  list(n = nrow(no2_df))
ex.data <-
  list(y = no2_df$y,
       easting = easting_scaled,
       northing = northing_scaled,
       altitude = altitude_scaled,
       distMatrix = obsDist)
params <- c( "beta0",  "beta1","beta2","beta3" ,"phi",  "tau", "sigma", "tau_sq", "sigma_sq")
inits <- list( sigma = 0.1, phi_inv = 6/max(obsDist), tau = 0.1)
# Run model in nimble
start_time <- Sys.time()

mcmc.out <- nimbleMCMC(
  code = NO2Code,
  constants = constants,
  data = ex.data,
  inits = inits,
  monitors = params,
  niter = 40000,
  nburnin = 20000,
  thin = 14,
  WAIC = TRUE,
  nchains = 2,
  summary = TRUE,
  samplesAsCodaMCMC = TRUE
)
end_time <- Sys.time()
run_time <- end_time - start_time
run_time## [1] 686.3596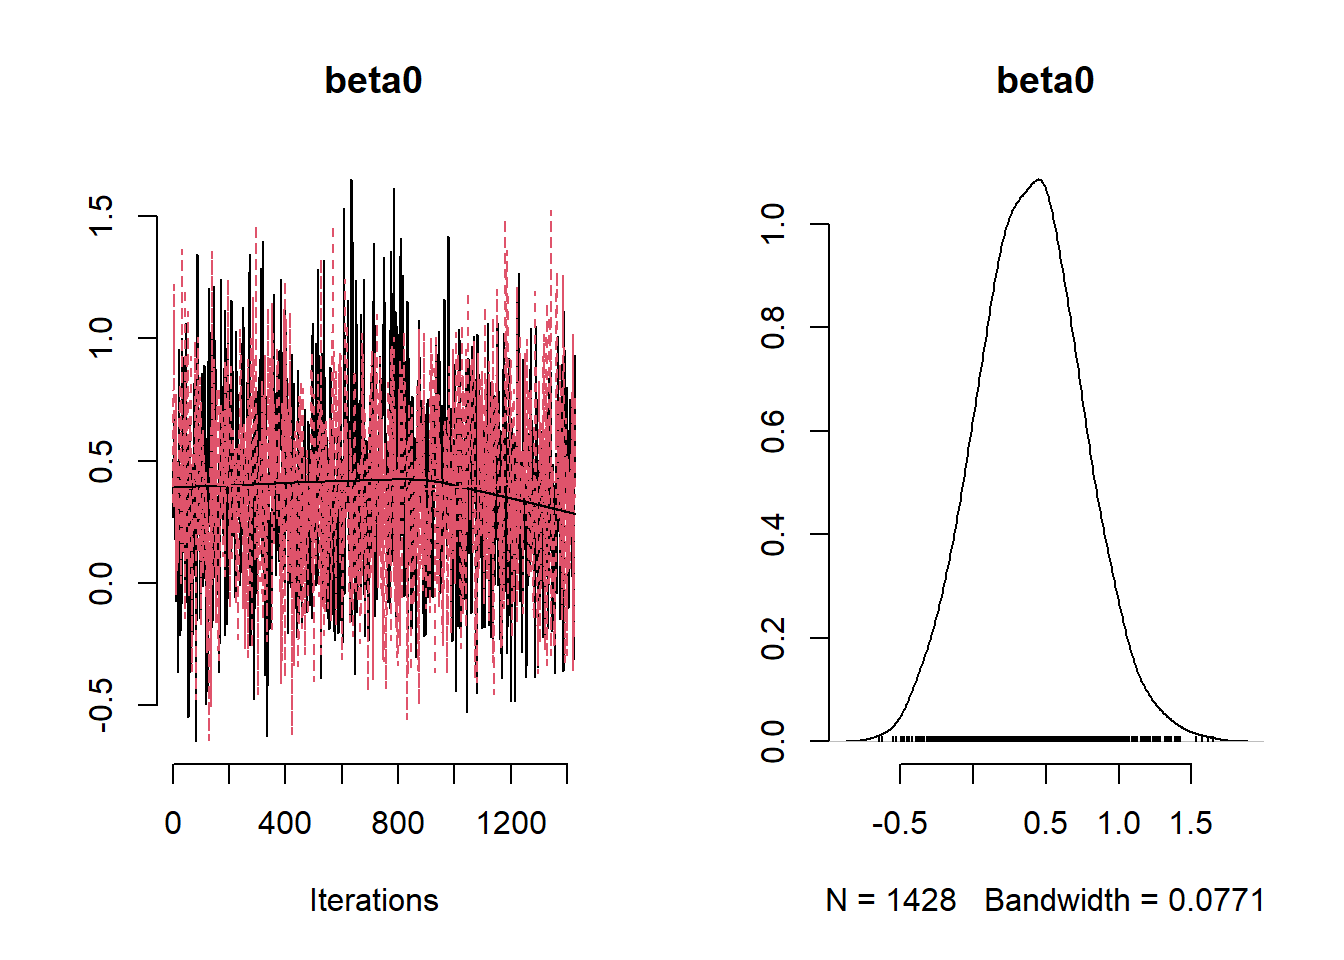
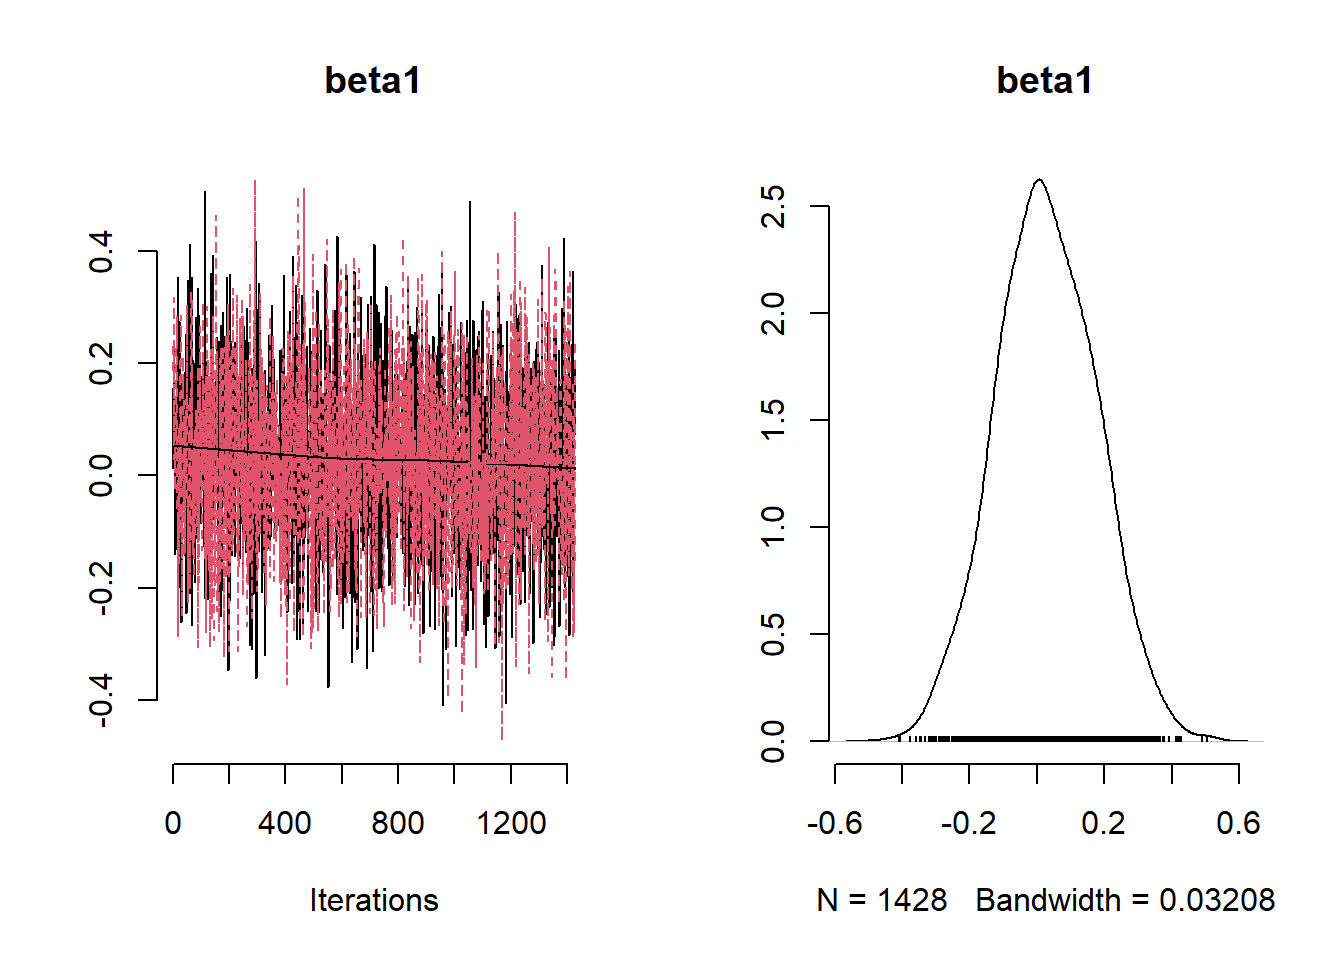
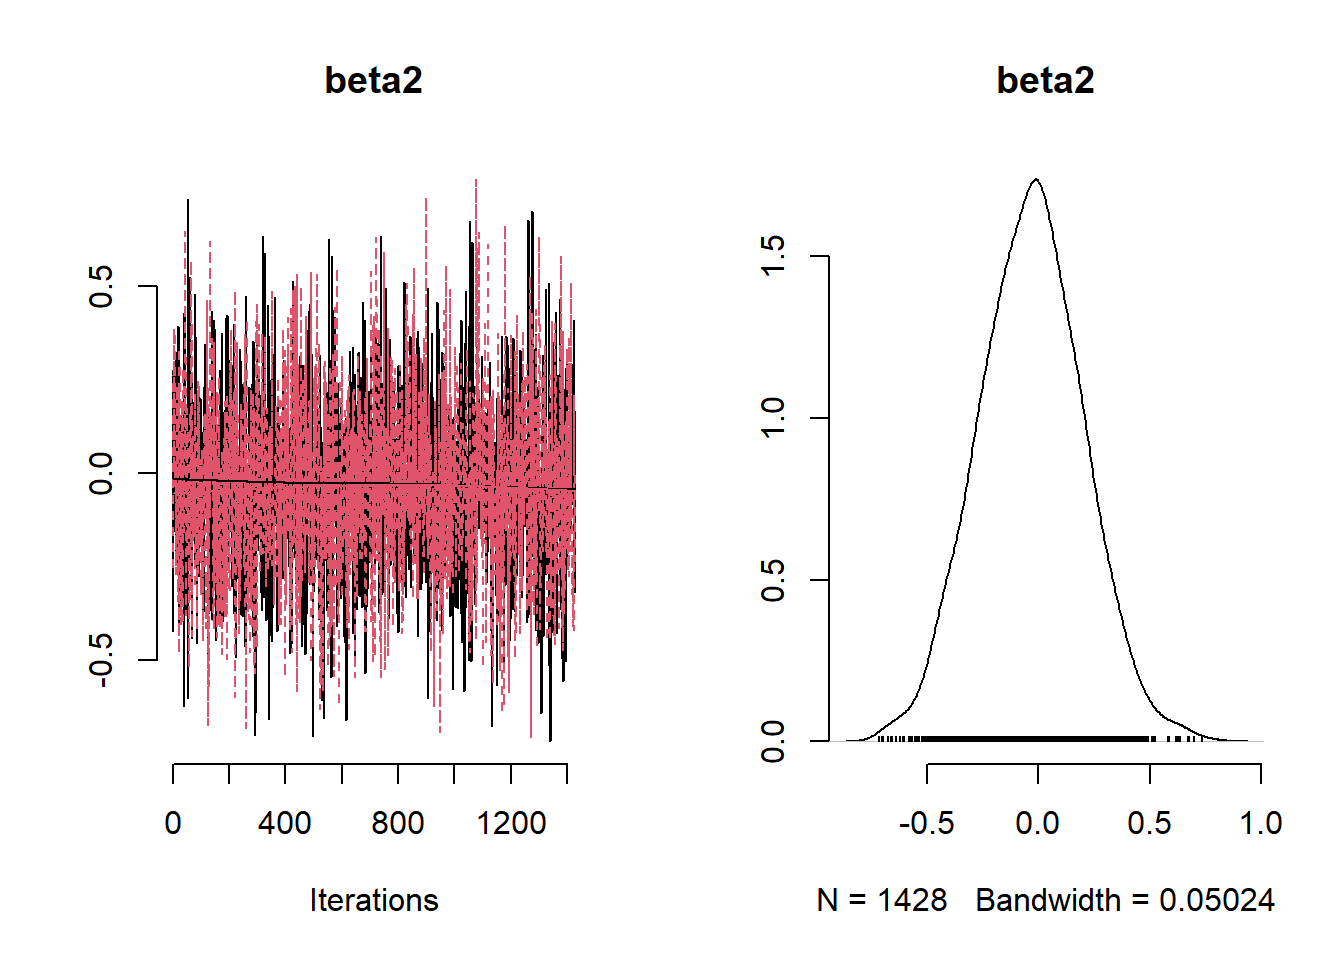
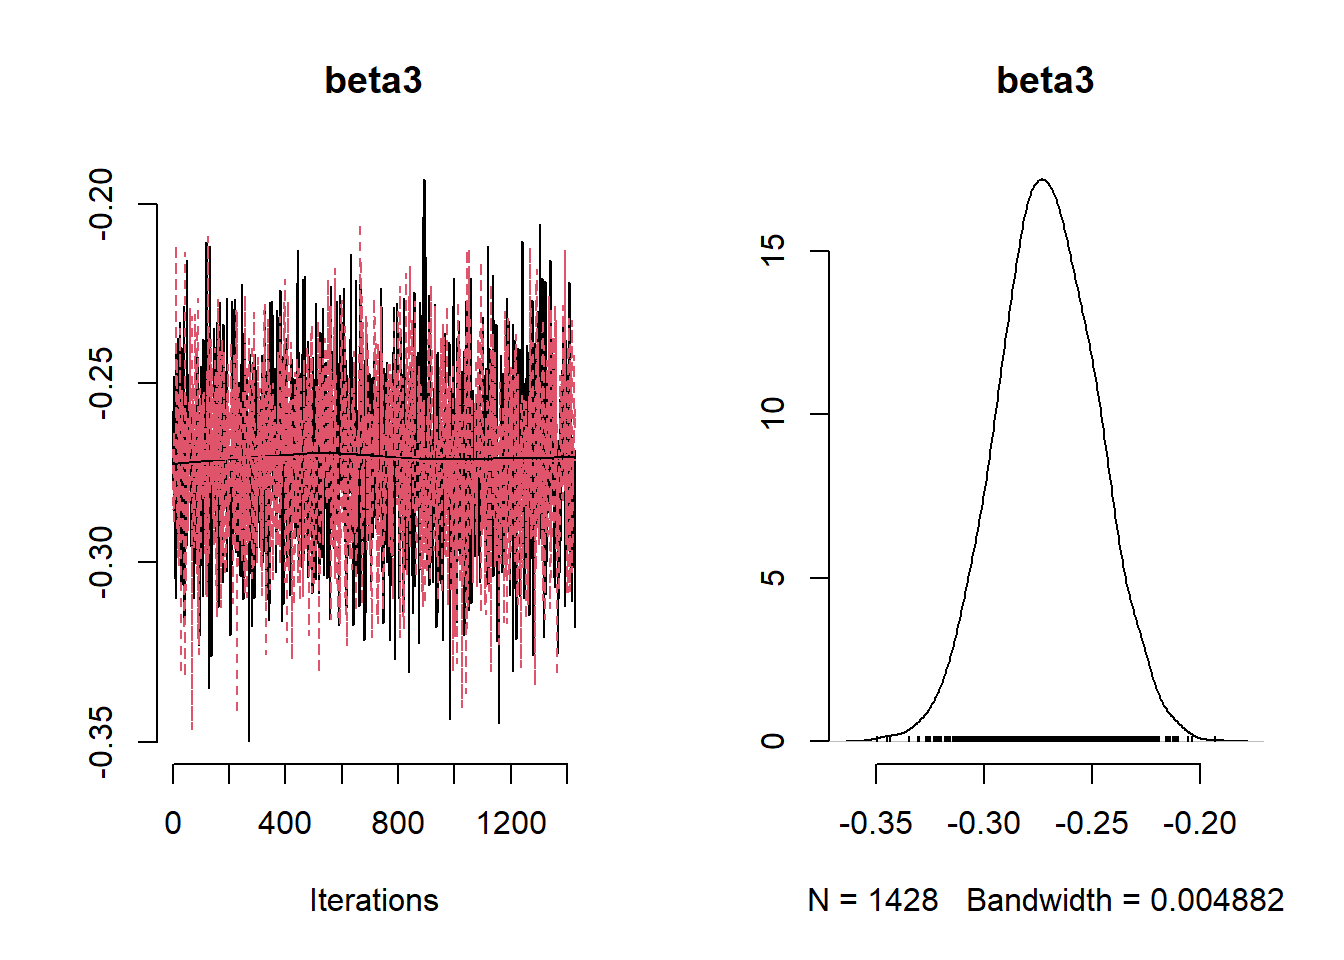
##               Mean       Median      St.Dev.   95%CI_low    95%CI_upp
## beta0   0.39364392   0.39277941   0.35719331  -0.3016104    1.1088945
## beta1   0.02804111   0.02476766   0.14864272  -0.2668795    0.3173510
## beta2  -0.03237002  -0.02862977   0.23275470  -0.4791750    0.4258925
## beta3  -0.27094361  -0.27115308   0.02261553  -0.3151008   -0.2270682
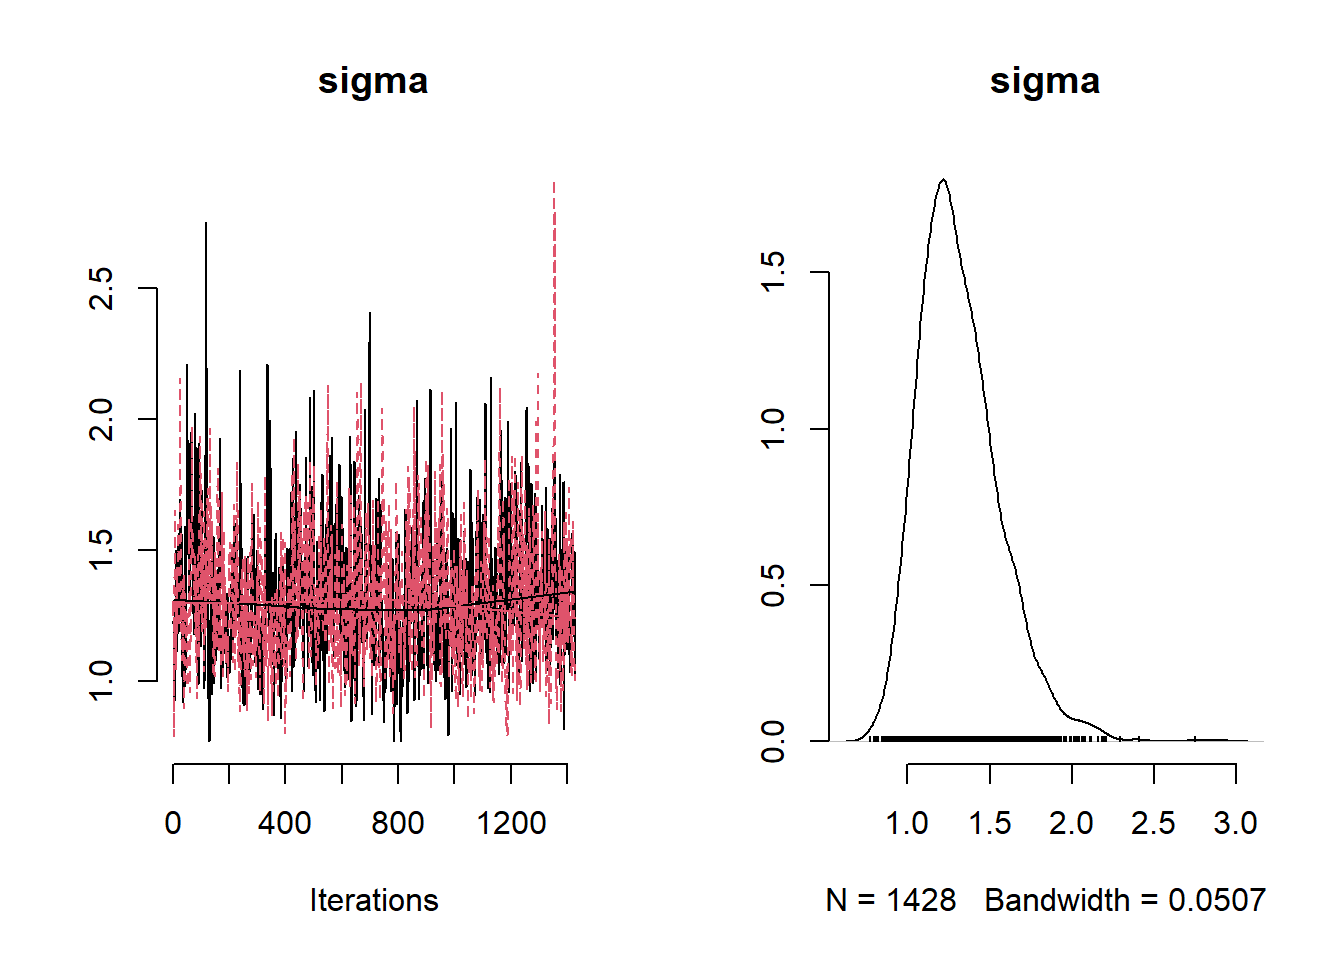
## sigma   1.31724434   1.27765984   0.24708799   0.9322191    1.8713042
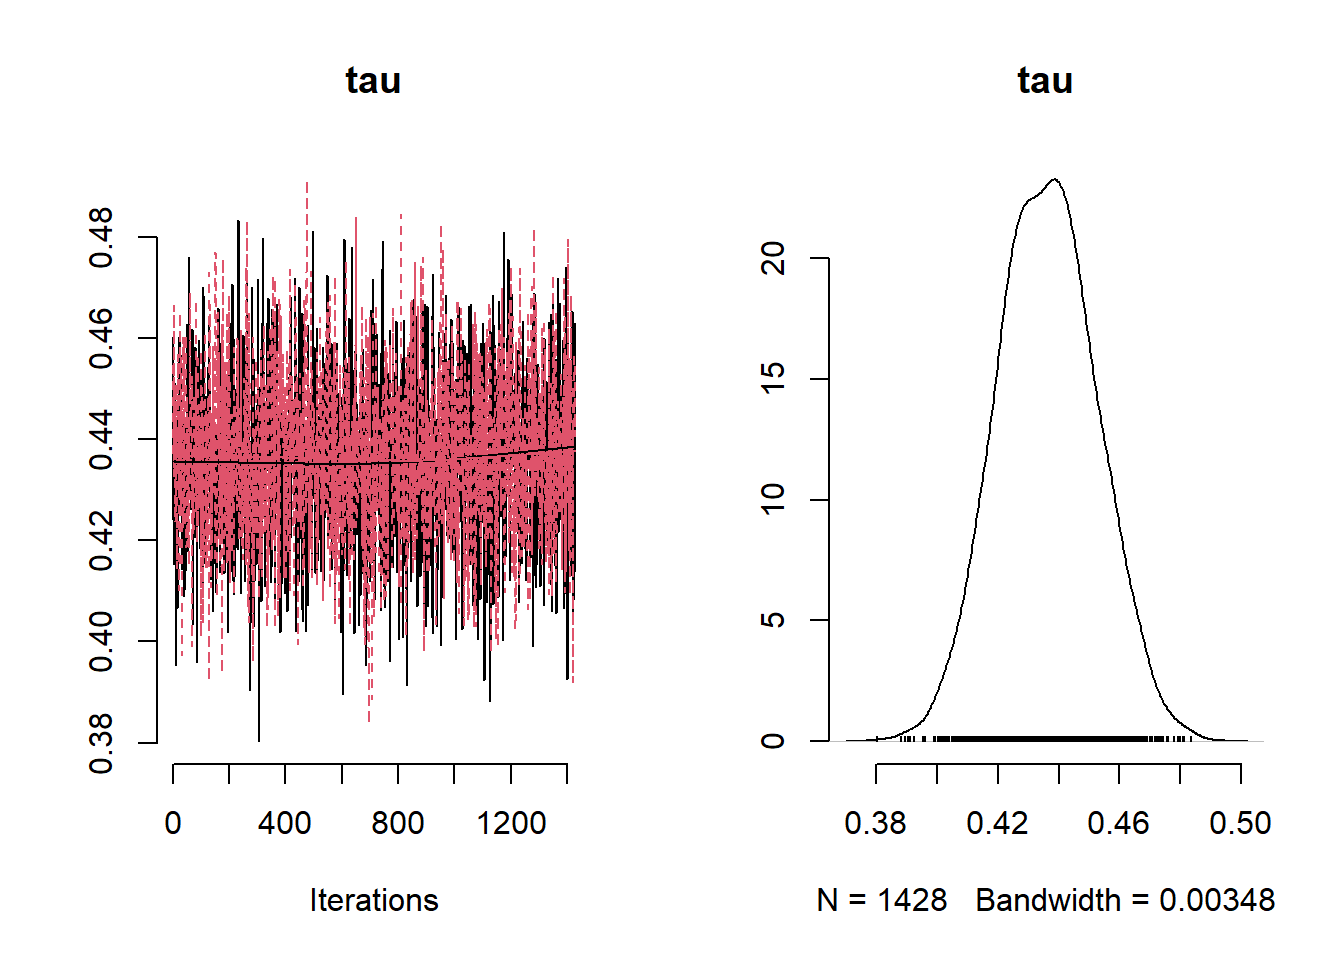
## tau     0.43624410   0.43606721   0.01611994   0.4056233    0.4675887
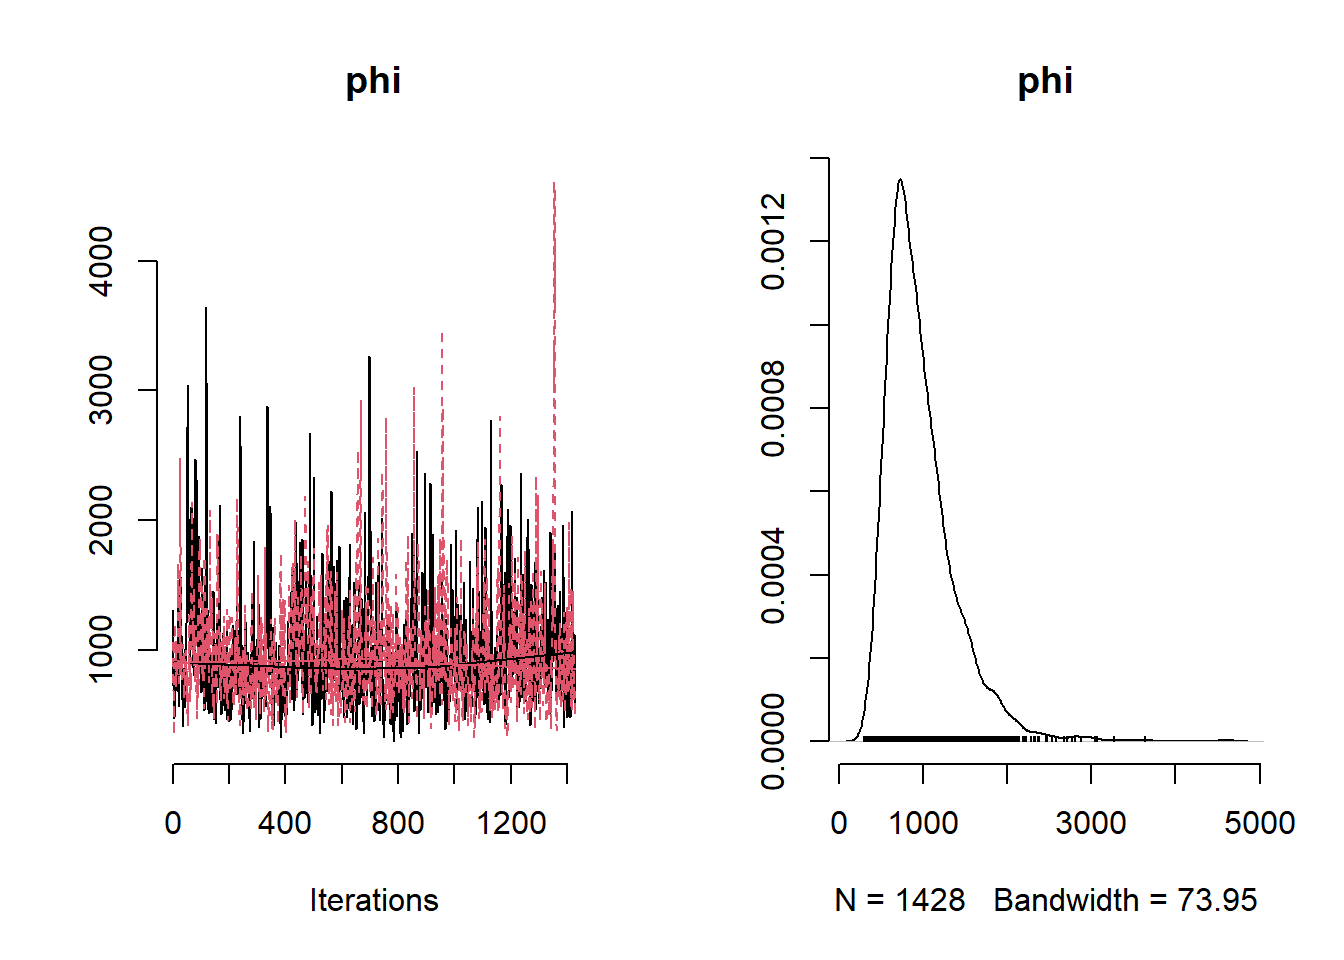
## phi 966.33919625 874.35628803 421.02076899 446.1835680 1979.0718225library(rgdal)
grid <- sf::st_read("data/no2_europe/10km_grid.shp")
covs_grid <- read.csv("data/no2_europe/centroids_altitude.csv")
covs_grid_utm <- rename(covs_grid, x = lon, y = lat)
covs_grid_utm <-
mutate(covs_grid_utm, zone2 = (floor((x + 180)/6) %% 60) + 1, keep = "all") |>
group_by(zone2) |>
mutate(utm_x = get_utm(x, y, zone2, loc = "x"),
utm_y = get_utm(x, y, zone2, loc = "y"))|> as.data.frame() |>
dplyr::select(id, utm_x, utm_y, starts_with("eu_dem_v11")) |>
gather(layer, altitude, -c(id, utm_x, utm_y), na.rm = TRUE)
# Scale covariates grid
covs_grid_sc <- covs_grid_utm[,c("utm_x", "utm_y", "altitude")]
predCoords <- covs_grid_utm[,c("utm_x", "utm_y")]/1000
covs_grid_sc$utm_x <- ((covs_grid_sc$utm_x/1000) - mean(no2_df$easting))/sd(no2_df$easting)
covs_grid_sc$utm_y <- ((covs_grid_sc$utm_y/1000) - mean(no2_df$northing))/sd(no2_df$northing)
covs_grid_sc$altitude <- (covs_grid_sc$altitude - mean(no2_df$altitude))/sd(no2_df$altitude)# Extract samples from nimble model
tidy_post_samples <- mcmc.out$samples |> tidy_draws()
# Extract posterior samples for each of the parameters of interest
post_beta0 <- tidy_post_samples$beta0 |> median()
post_beta1 <- tidy_post_samples$beta1 |> median()
post_beta2 <- tidy_post_samples$beta2 |> median()
post_beta3 <- tidy_post_samples$beta3 |> median()
post_sigmasq <- tidy_post_samples$sigma_sq |> median()
post_phi <- tidy_post_samples$phi |> median()
post_tausq <- tidy_post_samples$tau_sq |> median()
n0 <- nrow(covs_grid_sc)
# L <- length(post_tausq)
L <- 1
obsMu <- cbind(1, easting_scaled, northing_scaled, altitude_scaled) %*% t(cbind(post_beta0, post_beta1, post_beta2, post_beta3))
predMu <- cbind(1, as.matrix(covs_grid_sc)) %*% t(cbind(post_beta0, post_beta1, post_beta2, post_beta3))
pred2obsDist <- fields::rdist(predCoords, obsCoords)
Rcpp::sourceCpp("functions/prediction_marginal_gp12.cpp")
args(prediction_marginal_gp12)## function (y, obsMu, predMu, obsDistMat, pred2ObsDistMat, sigmasq,
## phi, tausq, iterprint)
## NULLsystem.time(
pred_samples <- prediction_marginal_gp12(
y = no2_df$y,
obsMu = obsMu,
predMu = predMu,
obsDistMat = obsDist,
pred2ObsDistMat = pred2obsDist,
sigmasq = post_sigmasq,
phi = post_phi,
tausq = post_tausq,
iterprint = 100
)
)## Prediction upto the 0th MCMC sample is completed## user system elapsed
## 4.36 0.16 29.20covs_grid_utm <- mutate(covs_grid_utm, pred = pred_samples)
cut_grid <- grid[(grid$id %in% covs_grid_utm$id),]
cut_grid <- cut_grid[order(cut_grid$id, decreasing = FALSE),]
covs_grid_utm <- covs_grid_utm[order(covs_grid_utm$id, decreasing = FALSE),]
cut_grid$pred <- covs_grid_utm$pred
ggplot() + geom_sf(data = cut_grid, colour = NA, aes(fill = pred)) +
ditch_the_axes + scale_fill_viridis_c(direction = -1, name = bquote("log" ~NO[2]* " concentration"))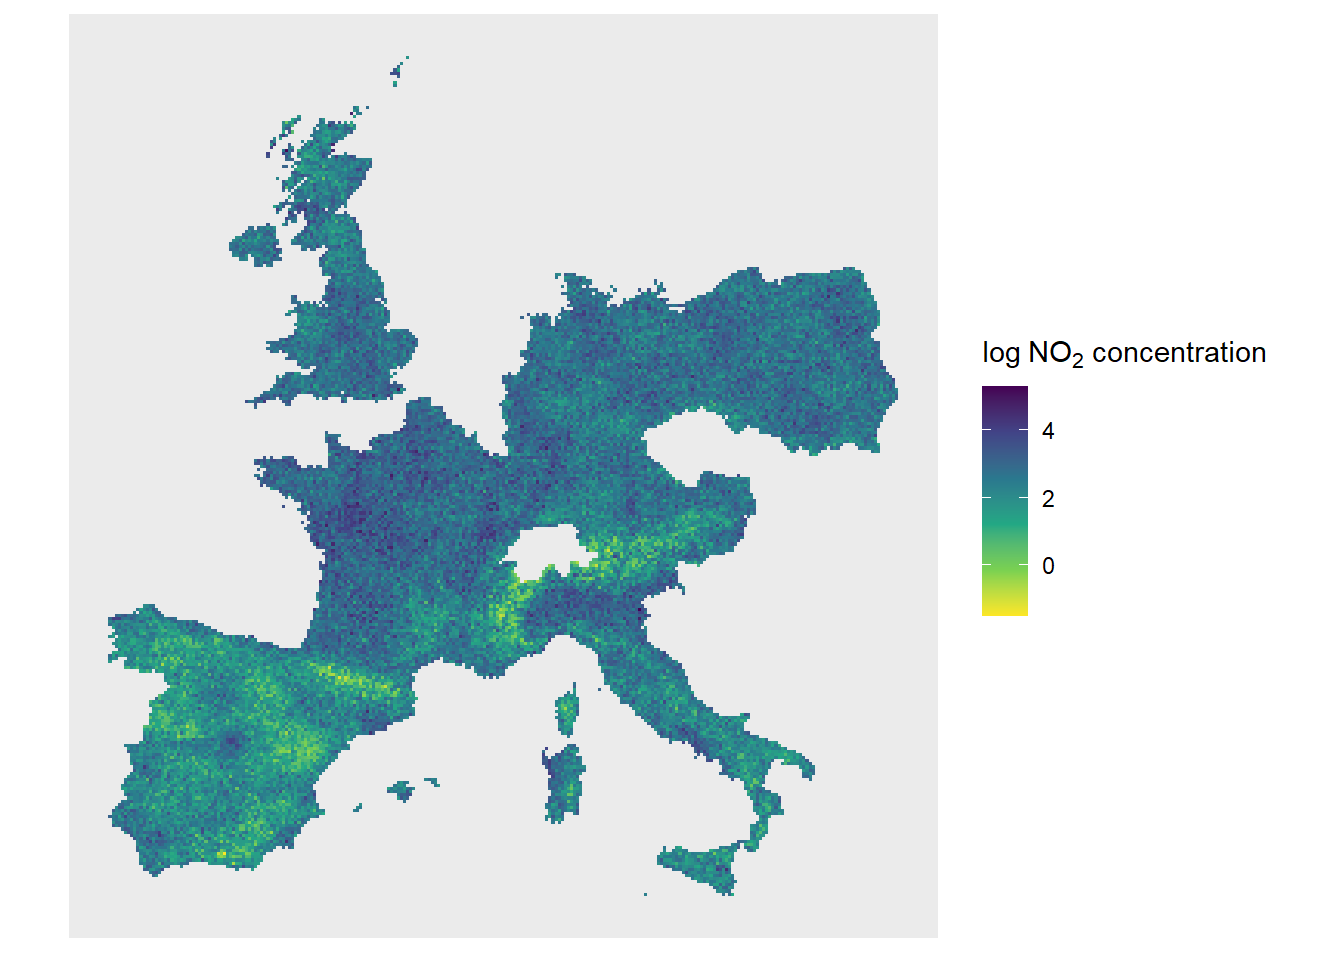
Example 10.10 Creating a mesh: black smoke monitoring locations in the UK
mesh = inla.mesh.create(
  locations[, 1:2],
  extend = list(offset = -0.1),
  cutoff = 1,
  # Refined triangulation, minimal angles >=26 degrees ,
  # interior maximal edge lengths 0.08,
  # exterior maximal edge lengths 0.2:
  refine = (list(
    min.angle = 26,
    max.edge.data = 100,
    max.edge.extra = 200
  ))
)

ukmap <-
  readShapeLines("uk_BNG.shp") plot(mesh , col = "gray", main = "")
lines(ukmap)
points(locations ,
       col = "red",
       pch = 20,
       bg = "red")
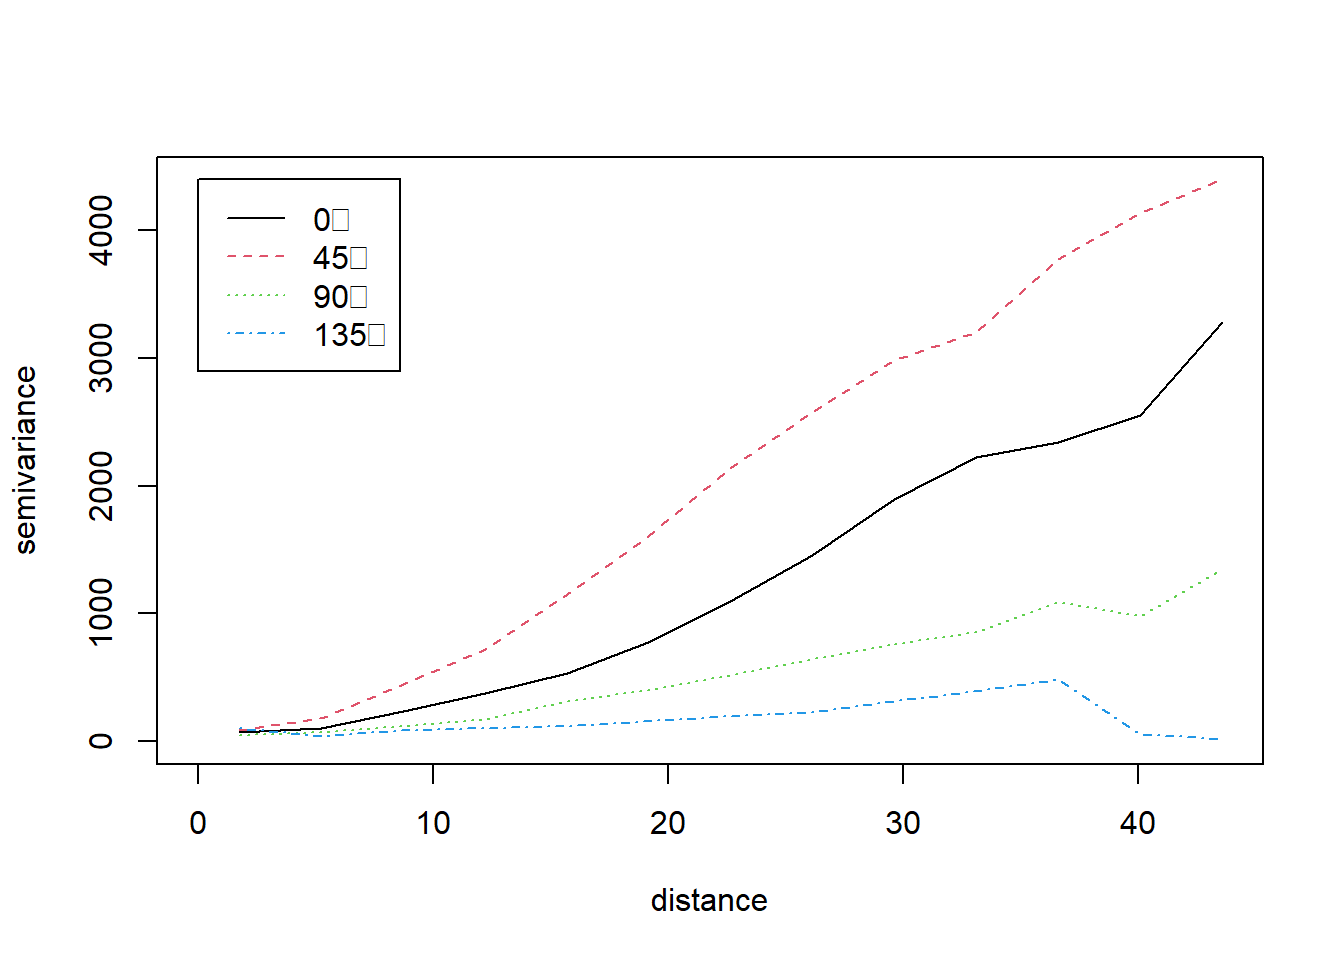
Example 10.12 Plotting directional variograms for temperatures in California
library(geoR)
library(sp)

### First we load the data
CAmetadata<- read.table("data/metadataCA.txt",header=TRUE)
CATemp<-read.csv("data/MaxCaliforniaTemp.csv",header=TRUE)
CATemp_20120401<-CATemp[CATemp$X==20120401, -c(1, 14)]
CATemp_20120401<-t(CATemp_20120401)

### Change names of lat, long
names(CAmetadata)[names(CAmetadata)=="Long"]<-"x"
names(CAmetadata)[names(CAmetadata)=="Lat"]<-"y"

### Augment data file with coordinates
CATemp_20120401 <- cbind(CAmetadata, CATemp_20120401/10)
names(CATemp_20120401)[names(CATemp_20120401) == "92"] <- "Temp"

CATempOri.geo <-
  as.geodata(CATemp_20120401,
             coords.col = 3:4,
             data.col = 7)

### Compute empirical variograms for the residual process with geoR.
###  The power variogram seemed best
### although this points to nonstationarity in the process
CA.vario4 <- variog4(CATempOri.geo, uvec = seq(0, 8, l = 8))
## variog: computing variogram for direction = 0 degrees (0 radians)
## tolerance angle = 22.5 degrees (0.393 radians)
## variog: computing variogram for direction = 45 degrees (0.785 radians)
## tolerance angle = 22.5 degrees (0.393 radians)
## variog: computing variogram for direction = 90 degrees (1.571 radians)
## tolerance angle = 22.5 degrees (0.393 radians)
## variog: computing variogram for direction = 135 degrees (2.356 radians)
## tolerance angle = 22.5 degrees (0.393 radians)
## variog: computing omnidirectional variogram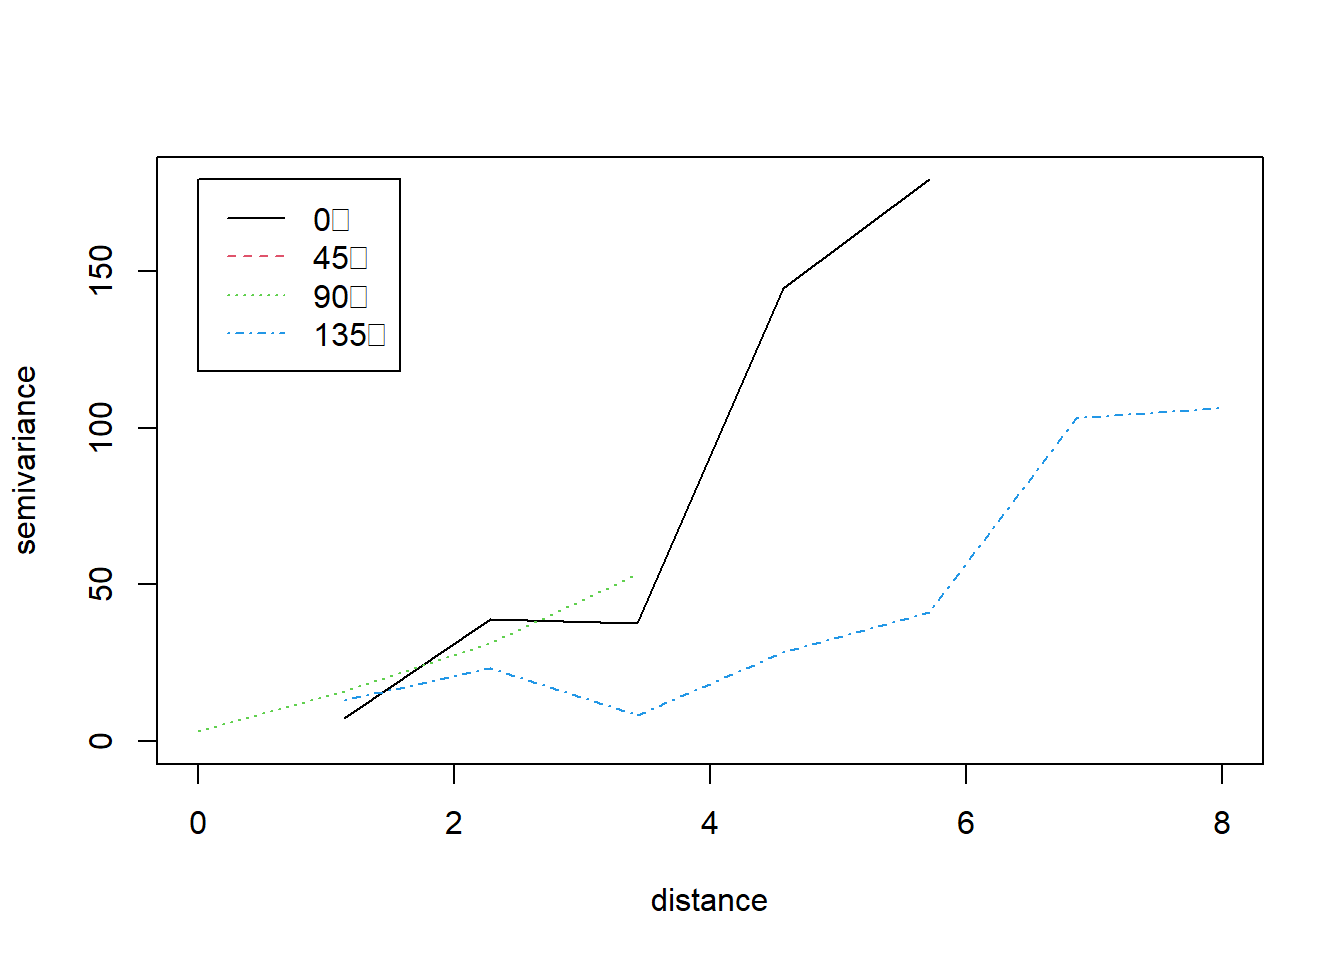
Example 10.14: Spatial modeling of malaria in Gambia
Note: There might be a warning when loading the \(\texttt{raster}\) package, if necessary, uninstall and re-install the package.
For this example we are using the same \(\texttt{gambia}\) data set from the \(\texttt{geoR}\) package but an \(\texttt{id_area}\) column was added using QGIS to differentiate the different areas as in the original paper. Therefore, we need to load the gambia_area.csv file.
library(dplyr) # to manipulate the data
library(geoR) # to get the dataset
library(leaflet) # to plot the map
library(nimble) # for modeling
library(sf) # manipulate spatial data
library(sp) # for manipulating spatial data
library(stringr) # to analyze posterior
library(viridis) # for a more cheerful color palette

# Note, we are using the same Gambia dataset as in the geoR package but an id_area
# attribute has been added using QGIS to a
gambia <- read.csv("data/malaria_gambia/gambia_area.csv") # gambia dataset from geoR package
Since the data is given at the individual level, we want to aggregate the malaria tests by village. If we explore the data frame we see that there are 2035 individuals at 65 villages.
##          x       y pos  age netuse treated green phc id_area
## 1 349631.3 1458055   1 1783      0       0 40.85   1       1
## 2 349631.3 1458055   0  404      1       0 40.85   1       1
## 3 349631.3 1458055   0  452      1       0 40.85   1       1
## 4 349631.3 1458055   1  566      1       0 40.85   1       1
## 5 349631.3 1458055   0  598      1       0 40.85   1       1
## 6 349631.3 1458055 1 590 1 0 40.85 1 1## [1] 2035 9## [1] 65 2We create a new data frame aggregated by village containing the coordinates, the number of malaria tests, and the prevalence.
malaria_village <- group_by(gambia, x, y) |>
  summarize(total = n(),
            positive = sum(pos),
            prev = positive / total) |> as.data.frame()
## `summarise()` has grouped output by 'x'. You can override using the `.groups`
## argument.## x y total positive prev
## 1 349631.3 1458055 33 17 0.5151515
## 2 358543.1 1460112 63 19 0.3015873
## 3 360308.1 1460026 17 7 0.4117647
## 4 363795.7 1496919 24 8 0.3333333
## 5 366400.5 1460248 26 10 0.3846154
## 6 366687.5 1463002 18 7 0.3888889# create a new variable in "sp" format and define coordinates
malaria_utm <- malaria_village
coordinates(malaria_utm) <- ~ x + y
proj4string(malaria_utm) <- CRS("+proj=utm +zone=28")
# convert to long lat
malaria_geo <- spTransform(malaria_utm, CRS("+proj=longlat +datum=WGS84"))
# add long lat coordinates to malaria dataframe
malaria_village[, c("long", "lat")] <- coordinates(malaria_geo)
# create map with location dots marked on it in
mypalette <- colorFactor(palette="inferno", domain=malaria_village$prev)
leaflet( data = malaria_village) |>
addTiles() |>
addProviderTiles("Esri.WorldImagery") |>
addCircleMarkers(
~ long,
~ lat,
fillOpacity = 0.8,
color = ~ mypalette(prev),
radius = 4,
opacity = 5,
stroke = FALSE)Nimble
Example10_14_Nimble <- nimbleCode({

  # Define priors
  sigma ~ T(dt(mu = 0, sigma = 1, df = 1), 0, Inf)
  sigma_sq <- sigma ^ 2
  phi_inv ~ dgamma(shape =  5, rate = 5)
  phi <- 1 / phi_inv

  Sigma[1:N, 1:N] <-
     sigma_sq*(1 + (sqrt(3)*obs_dist_mat[1:N, 1:N])/phi) * exp(-sqrt(3)*obs_dist_mat[1:N, 1:N] / phi)

    for(i in 1:N){
    mean_S[i] <- b0
    }

  S[1:N] ~ dmnorm(mean_S[1:N], cov = Sigma[1:N,1:N])

    for (j in 1:n) {  # by child
    logit(p[j])  <- inprod(b[1:k], X[j,1:k]) + S[index_village[j]]
    y[j] ~ dbern(p[j])
    }

  for (l in 1:k){
    b[l] ~ dnorm(0, sd = 5)
  }

  b0 ~ dnorm(0, sd = 5)


})
# distance specification
coords_sf <- sf::st_as_sf(malaria_village[,c("long","lat")],
coords = c("long","lat")) |>
sf::st_set_crs(4326)
obs_dist_mat <- sf::st_distance(coords_sf)
obs_dist_mat <- units::set_units(obs_dist_mat, km)
obs_dist_mat <- units::set_units(obs_dist_mat, NULL)
# define indicator variables for each village
gambia_df <- mutate(
gambia,
id_child = 1:nrow(gambia), # add an id for each child
value = 1, # this will be needed later for the villages
id_village = as.numeric(interaction( # add an id for the villages
x, y, drop = TRUE, lex.order = TRUE
))
) |>
tidyr::spread(id_area, value, fill = 0) |>
rename(area1 = '1', area2 = '2', area3 = '3', area4 = '4', area5 = '5')
## Model specification
# Variables matrix
X <- data.frame(age = scale(gambia_df[,"age"], center = TRUE, scale = FALSE),
netuse = gambia_df[,"netuse"],
treated = gambia_df[,"treated"],
green = scale(gambia_df[,"green"], center = TRUE, scale = FALSE),
phc = gambia_df[,"phc"],
area2 = gambia_df[,"area2"],
area3 = gambia_df[,"area3"],
area4 = gambia_df[,"area4"],
area5 = gambia_df[,"area5"]
)
index_village <- gambia_df[,"id_village"]
n <- nrow(X) # child number
N <- nrow(malaria_village) # number of villages
zeroes <- rep(0, N) # auxiliary vector of zeroes for model
ones <- rep(1, N)
const_list <- list(n = n, # number of childs
N = N, # number of villages
zeroes = zeroes, # vector of zeroes
prior_max_dist = max(obs_dist_mat)/6, # max dist for phi prior
k = ncol(X),# number of predictors
index_village = index_village,
Id10 = 10*diag(N))
dat_list <- list(y = gambia_df$pos, # malaria positive test
obs_dist_mat = obs_dist_mat, # distance matrix in km
X = X # predictors matrix
)
init_list <- list(sigma = 0.5,
p = rep(expit(rnorm(1, 0, 1)), n),
phi_inv = 6/max(obs_dist_mat),
b = rep(0, ncol(X)),
b0 = rnorm(1, 0, 1),
S = rnorm(N, 0, 1))
#init_list <- list(p = runif(n, 0, 1), b = rnorm(ncol(X), 0, 1), b0 = rnorm(1, 0, 1))
Rmodel <-
nimbleModel(
Example10_14_Nimble,
constants = const_list,
data = dat_list,
inits = init_list
)
Rmodel$initializeInfo()
Cmodel <- compileNimble(Rmodel, showCompilerOutput = FALSE)
conf <-
configureMCMC(Rmodel, monitors = c( "b0", "b", "p", "S", "sigma", "phi"))
# conf$removeSamplers(c('S'))
# conf$addSampler(target = c('S'), type = 'AF_slice')
Rmcmc <- buildMCMC(conf)
Cmcmc <-
compileNimble(
Rmcmc,
project = Cmodel,
resetFunctions = TRUE,
showCompilerOutput = TRUE
)
niters <- 80000
nburnins <- 0.5 * niters
nchains <- 2
nthins <- 14
post_samples <- runMCMC(
Cmcmc,
niter = niters,
nburnin = nburnins,
thin = nthins,
nchains = nchains,
samplesAsCodaMCMC = TRUE,
summary = TRUE
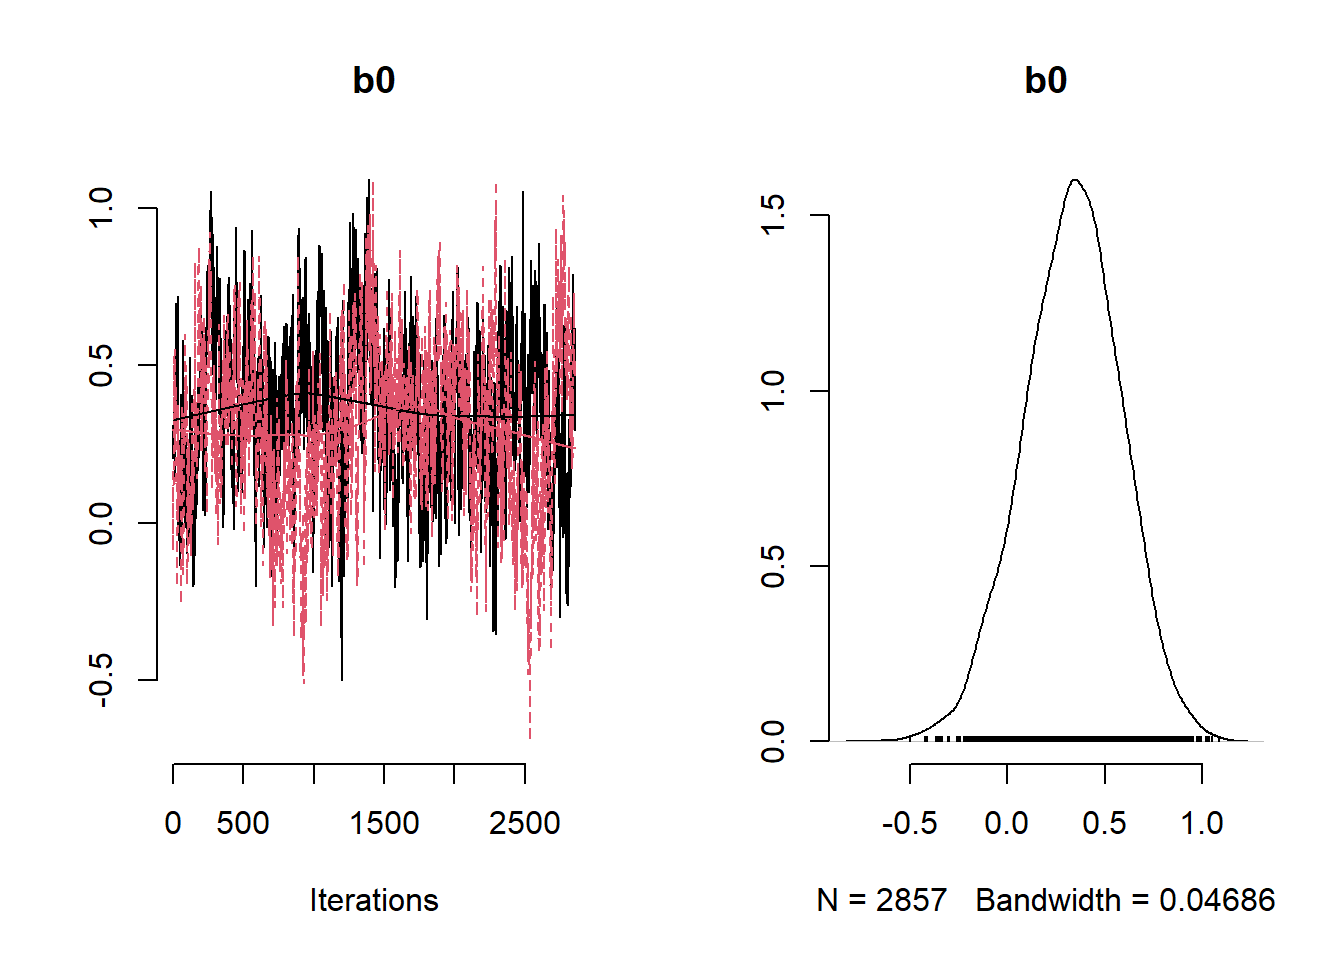
)
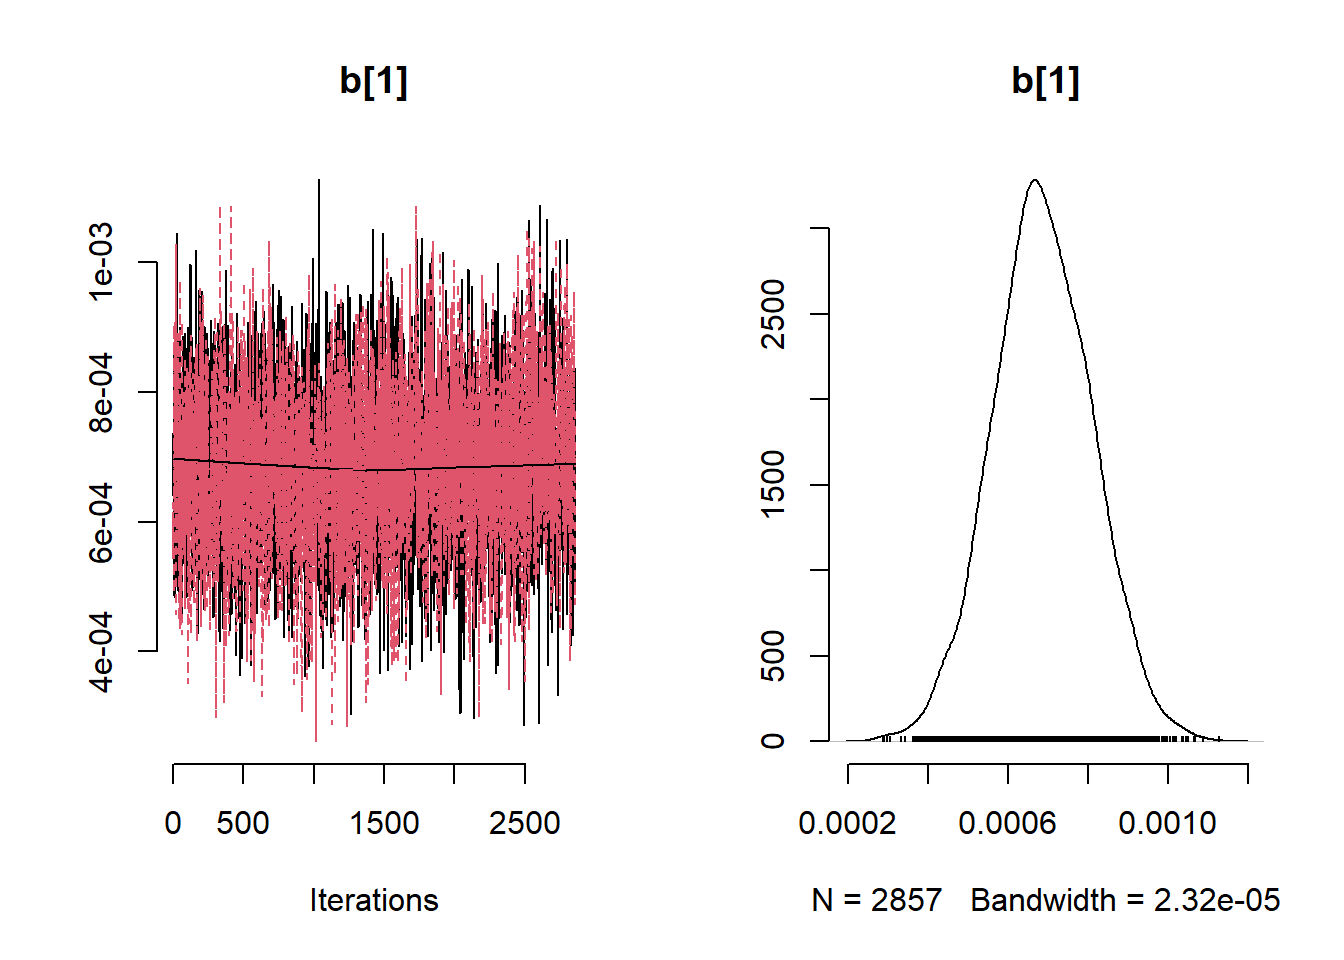
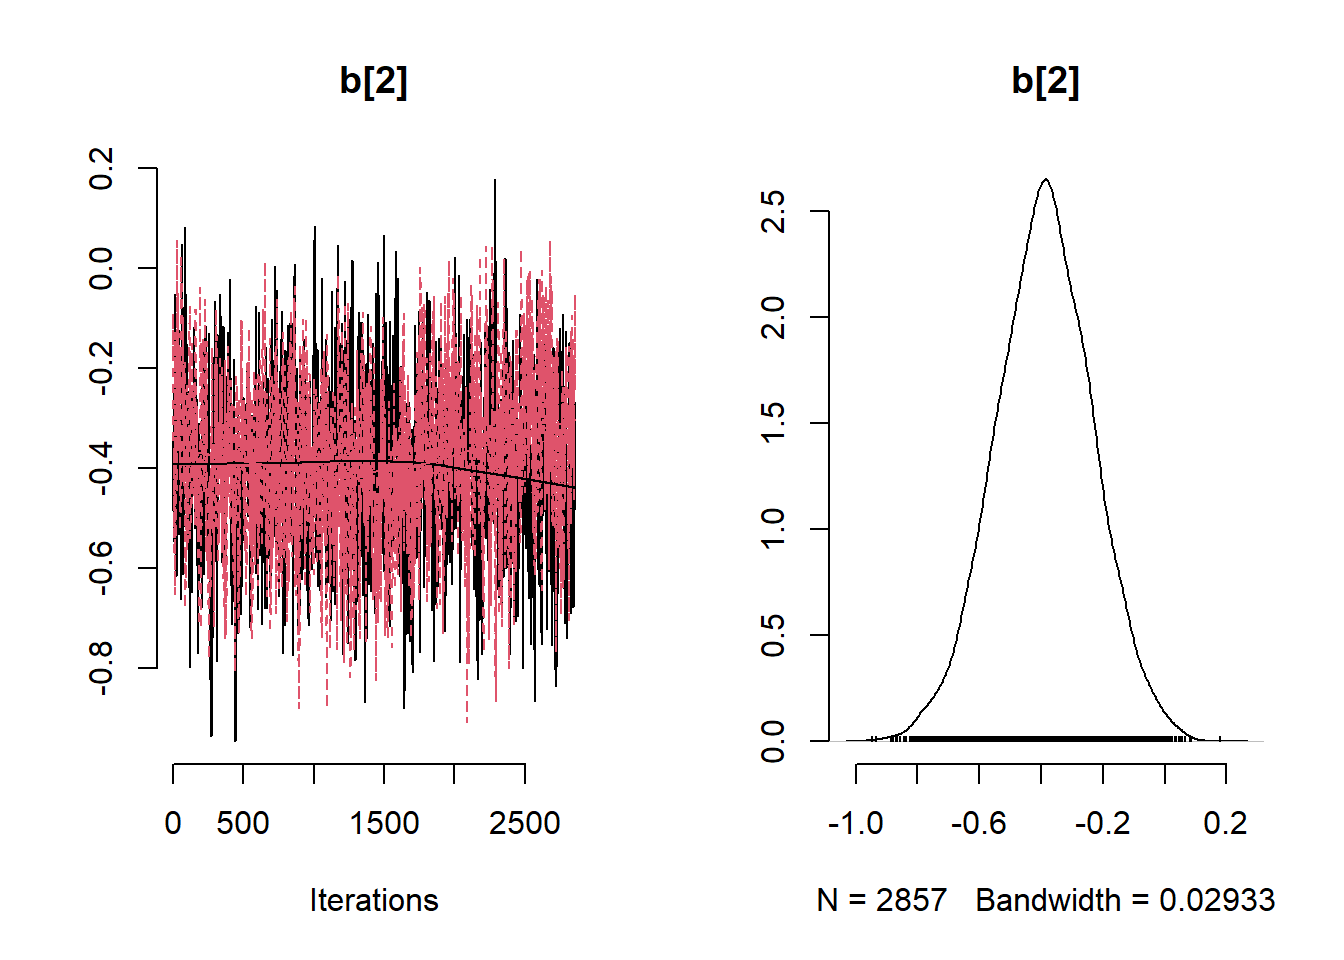

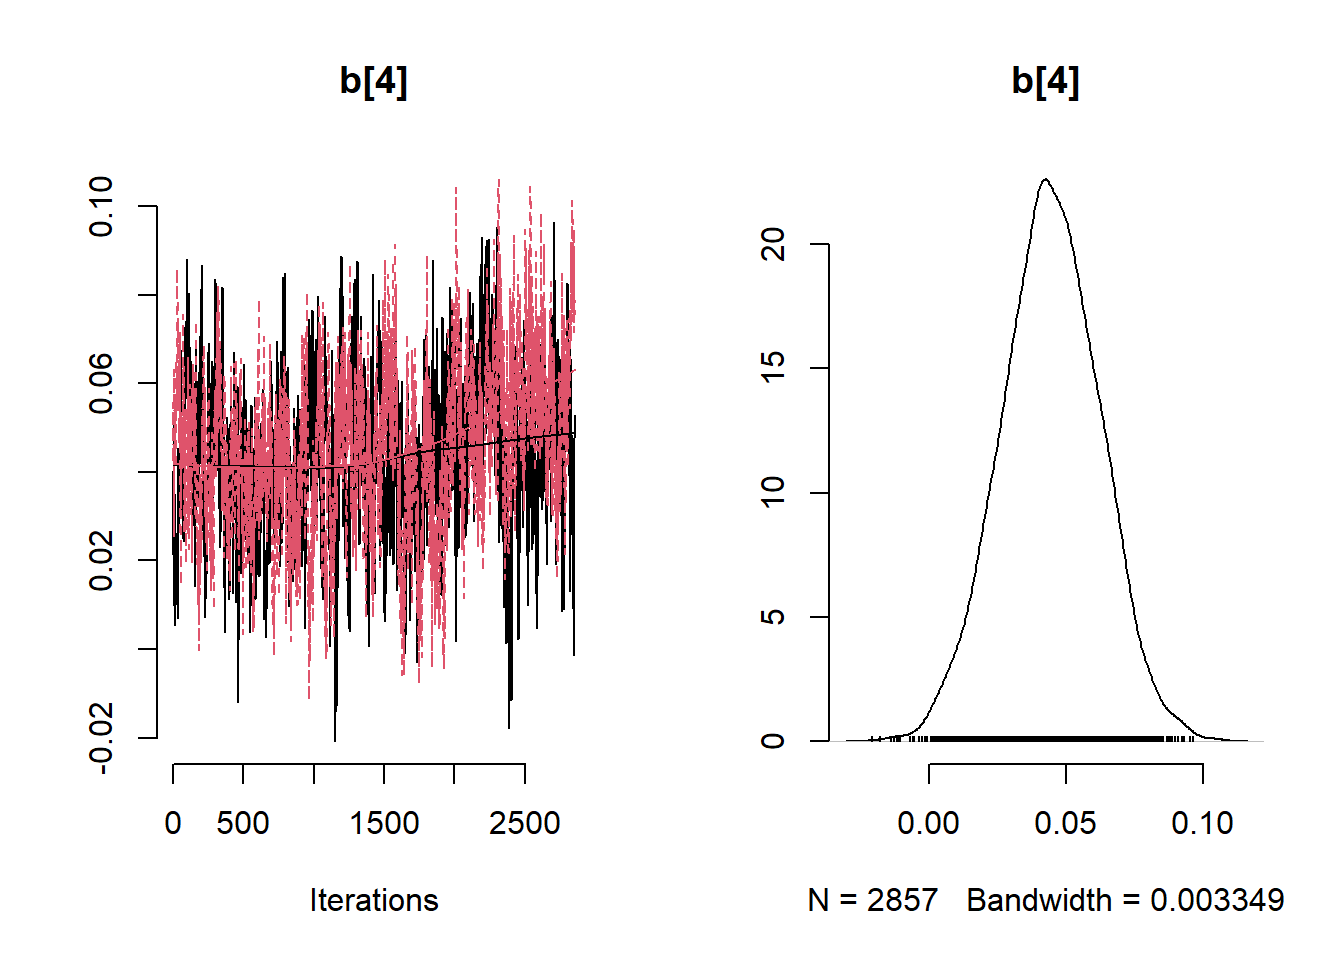
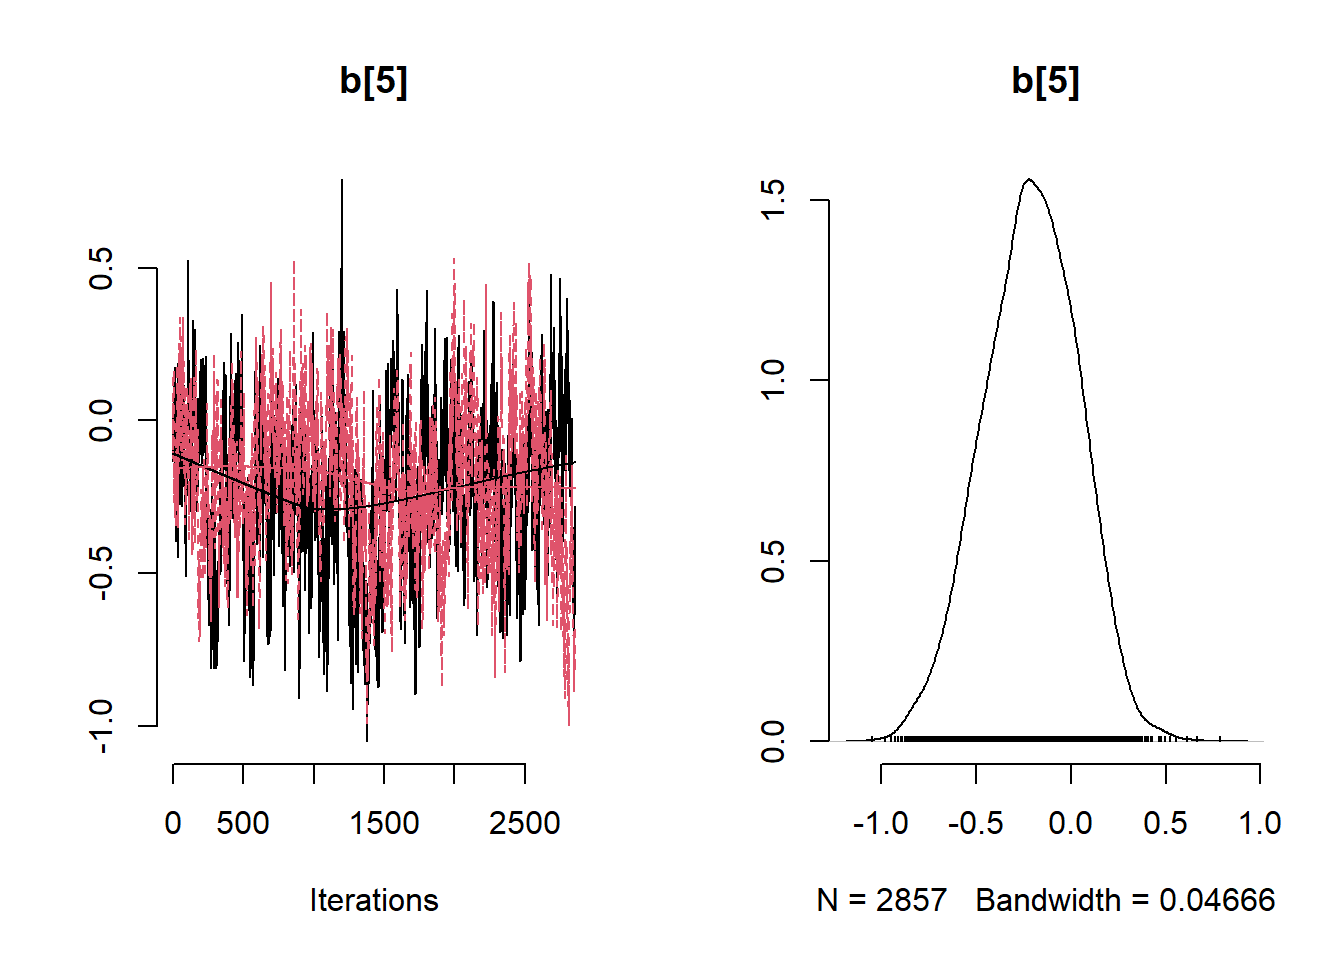
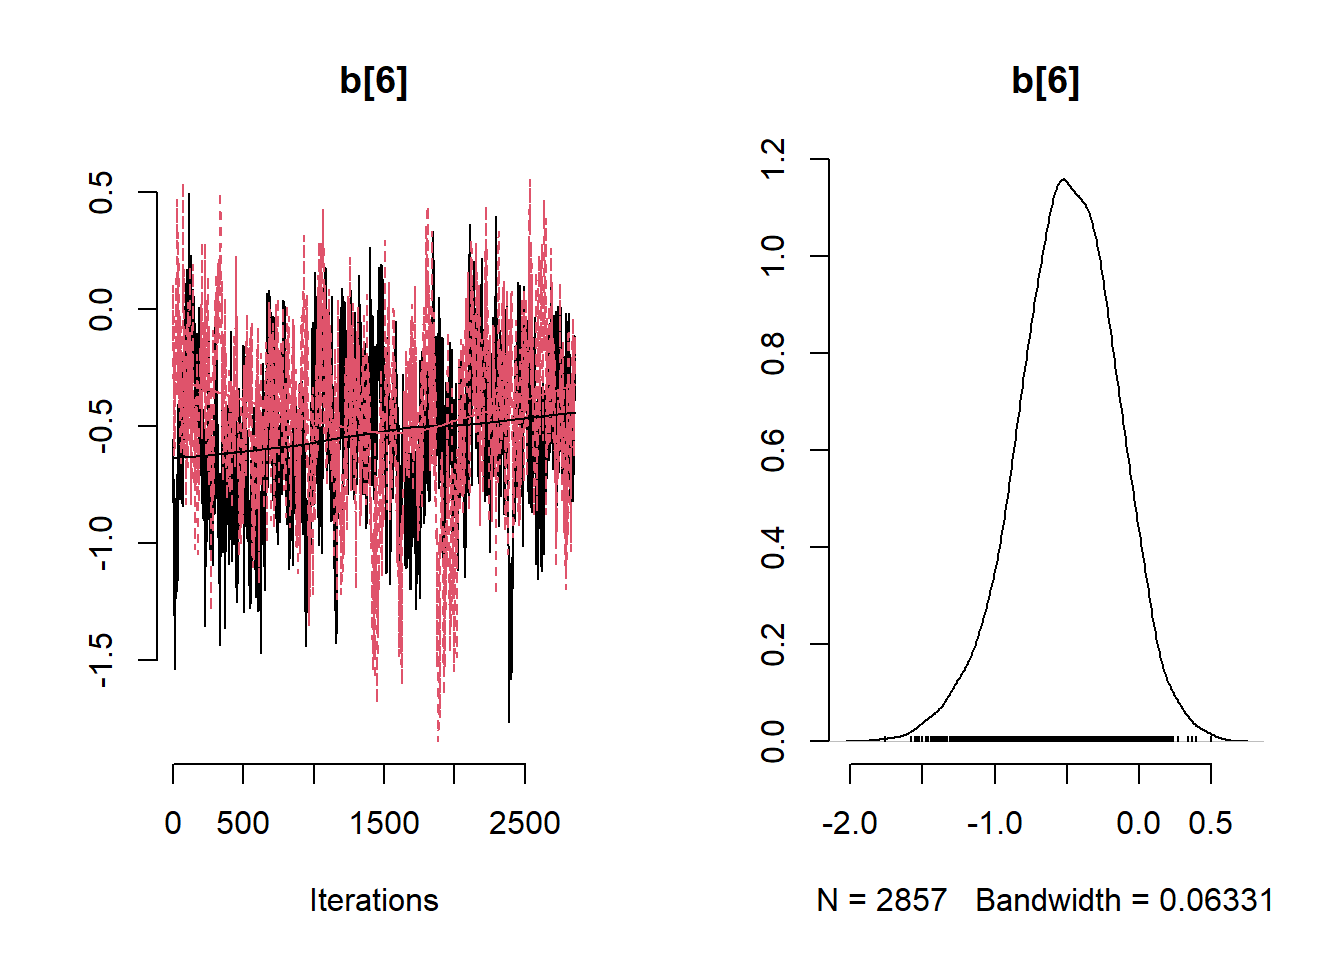
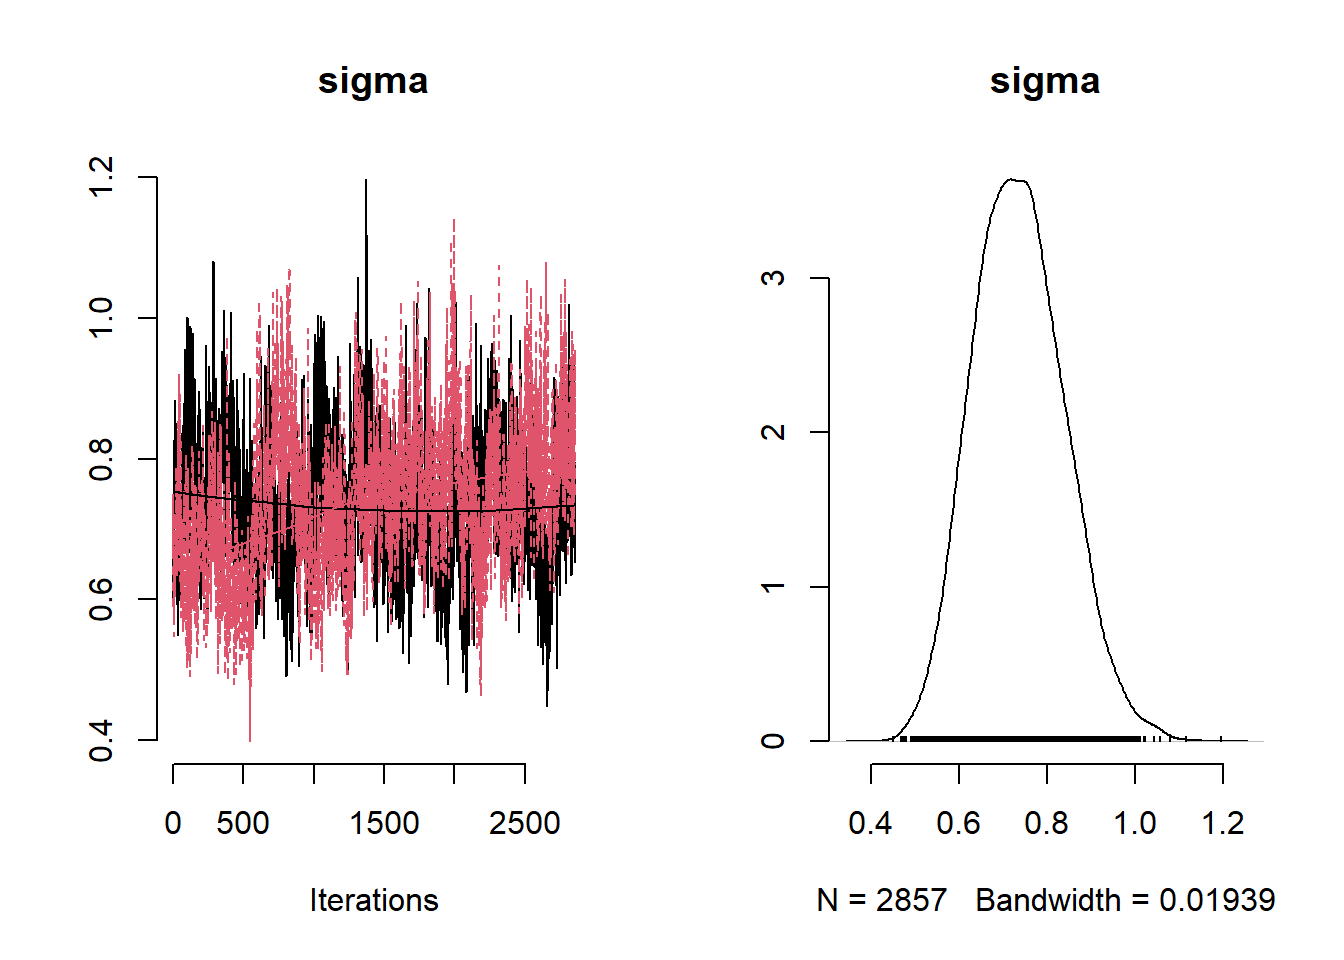
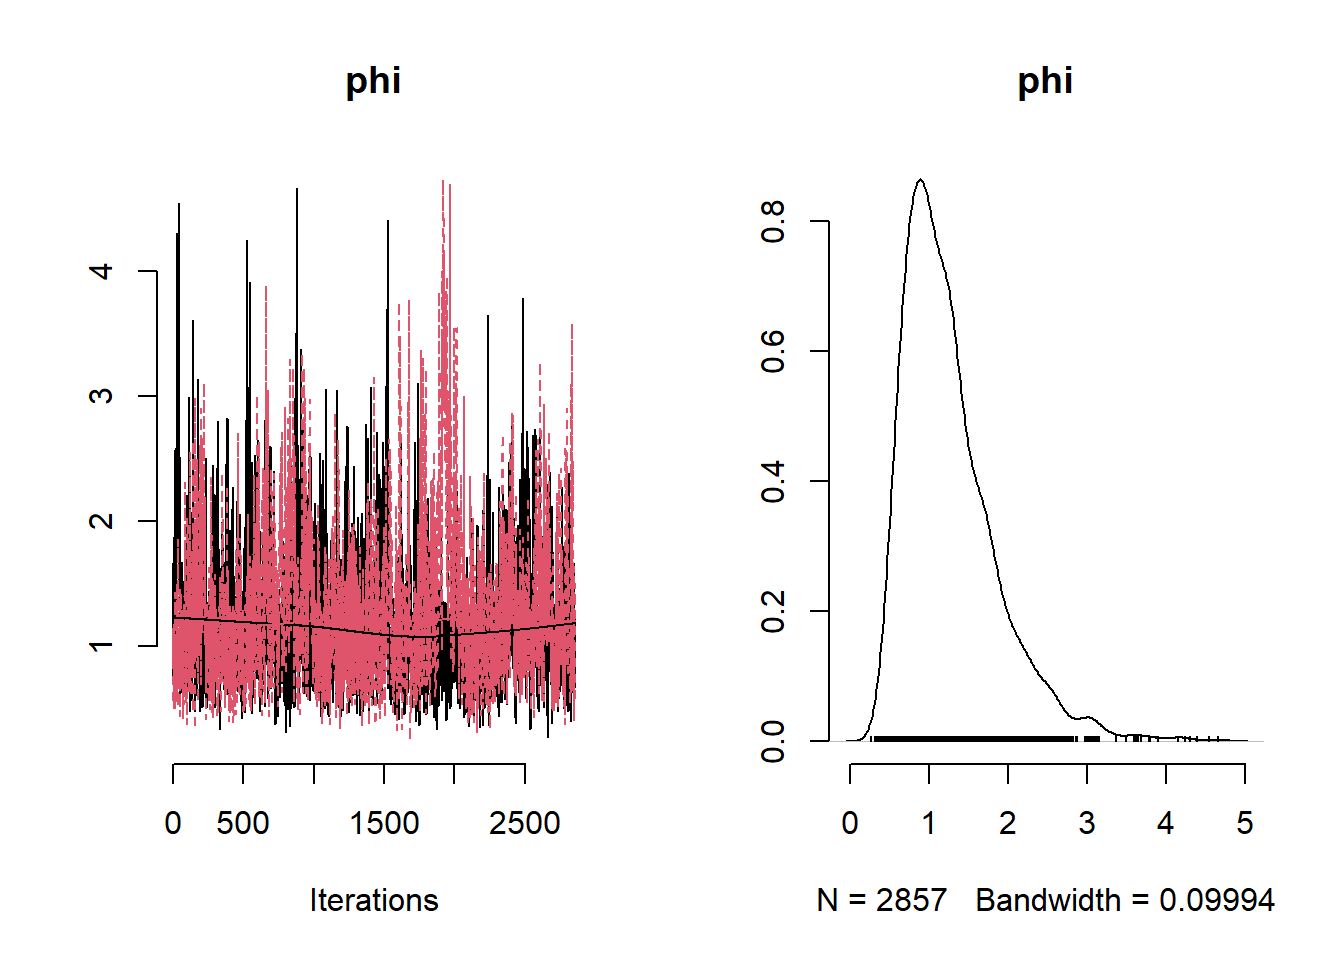
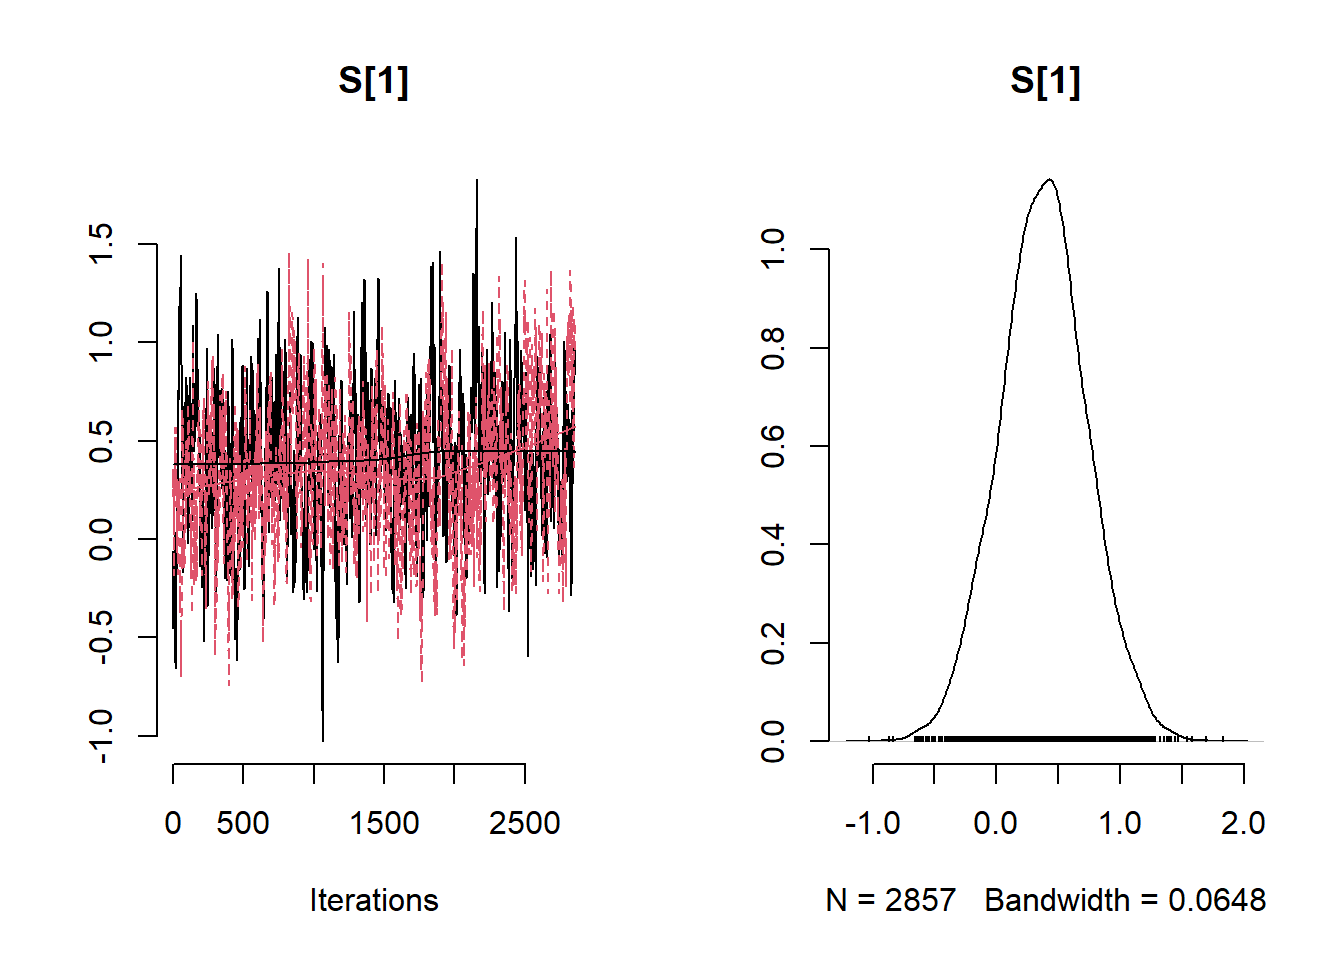
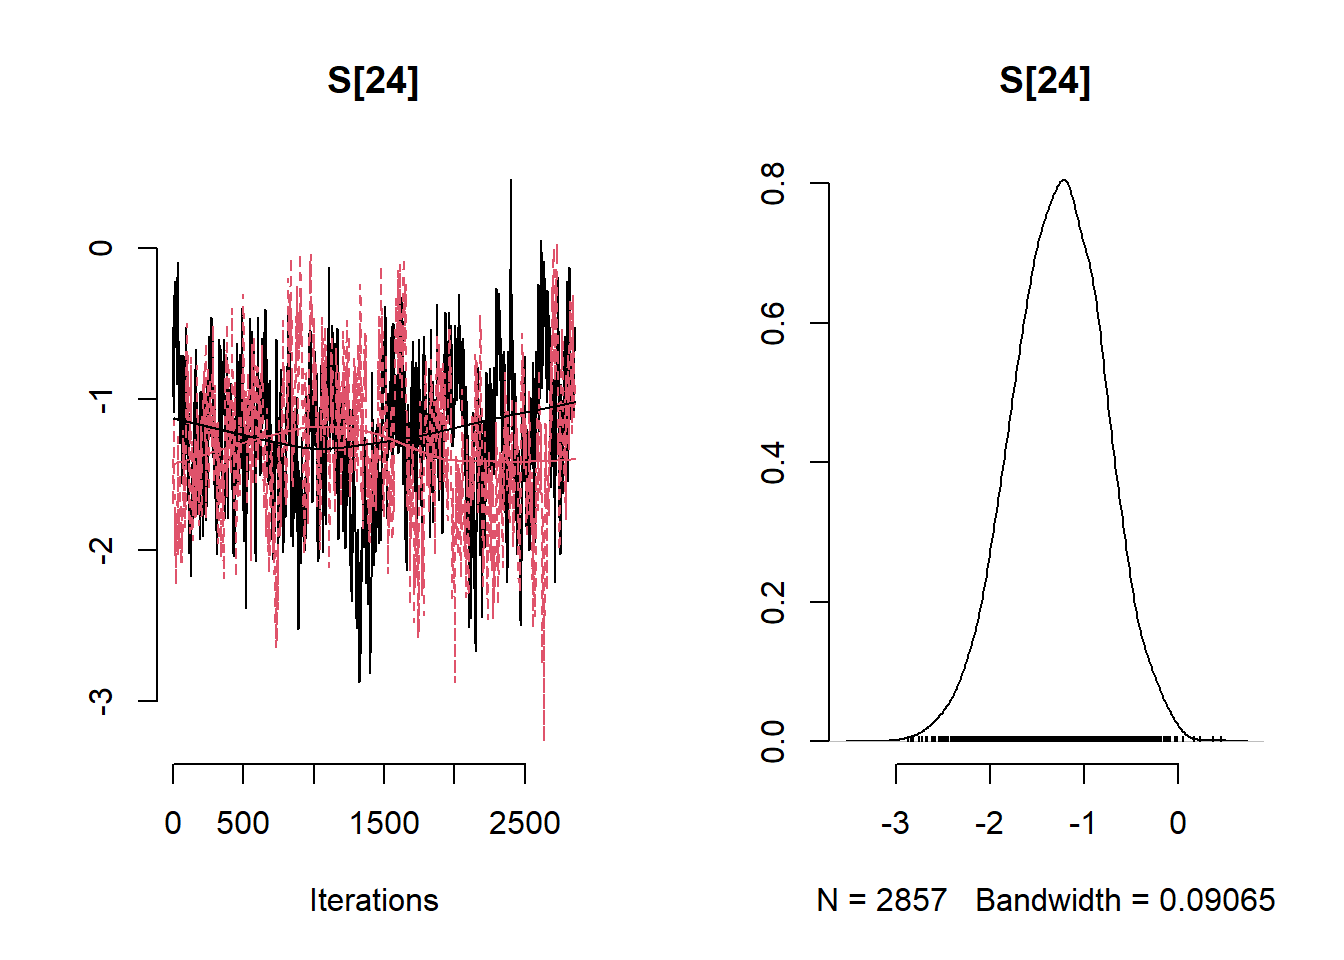
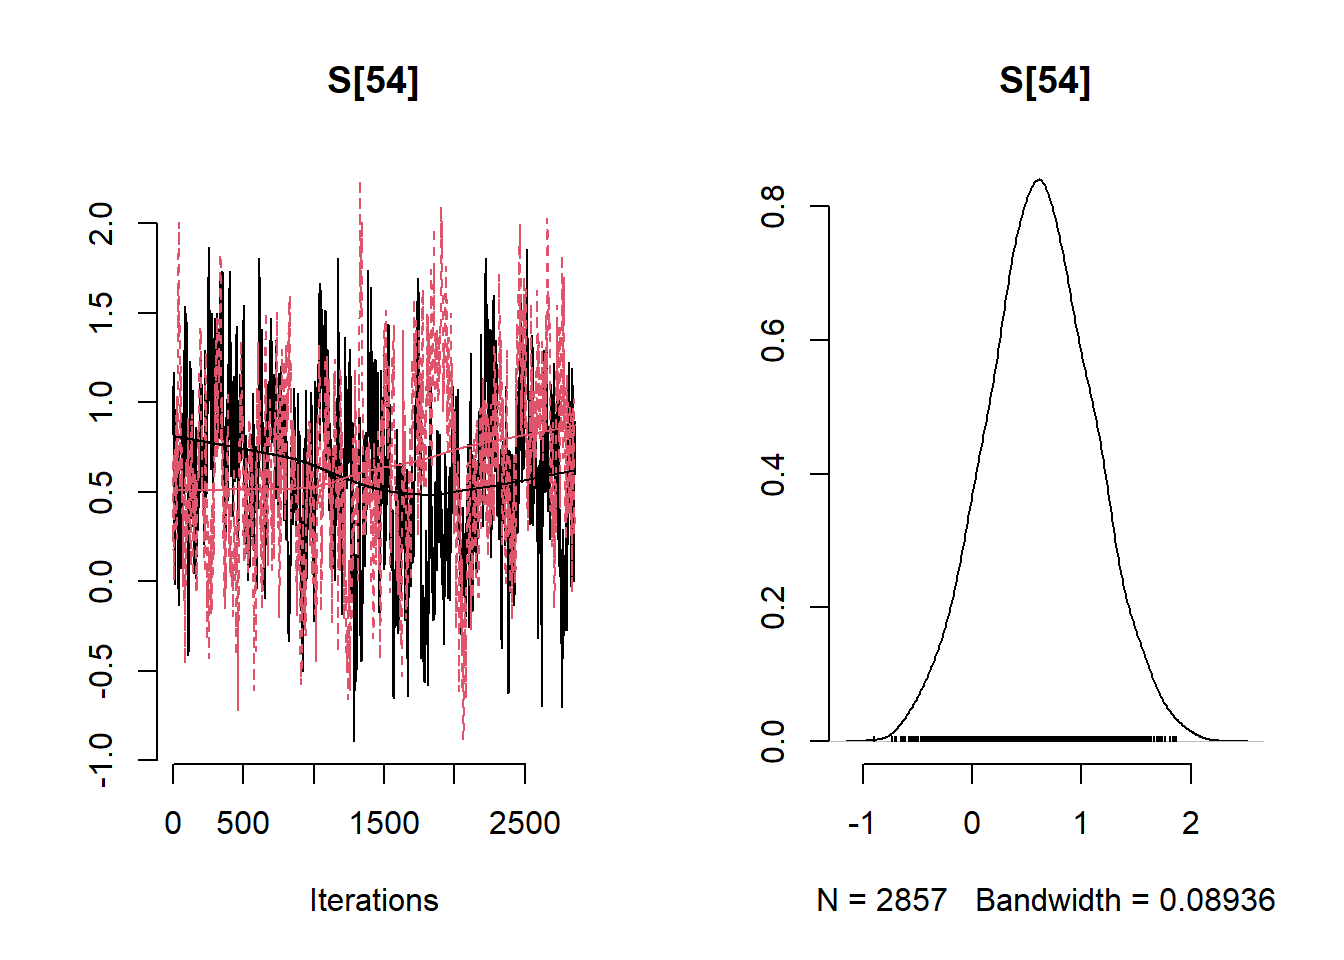
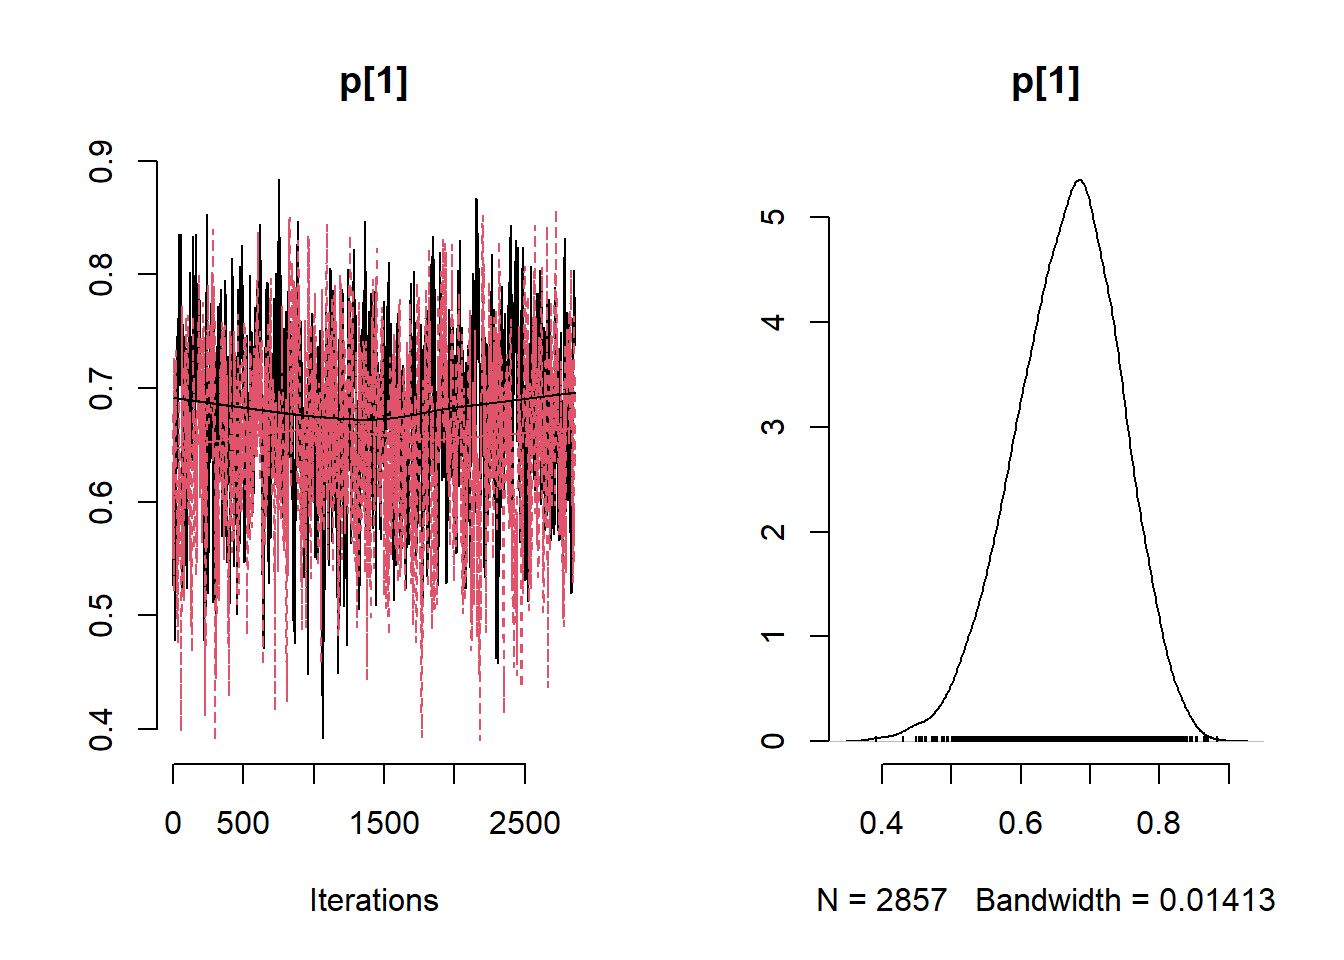
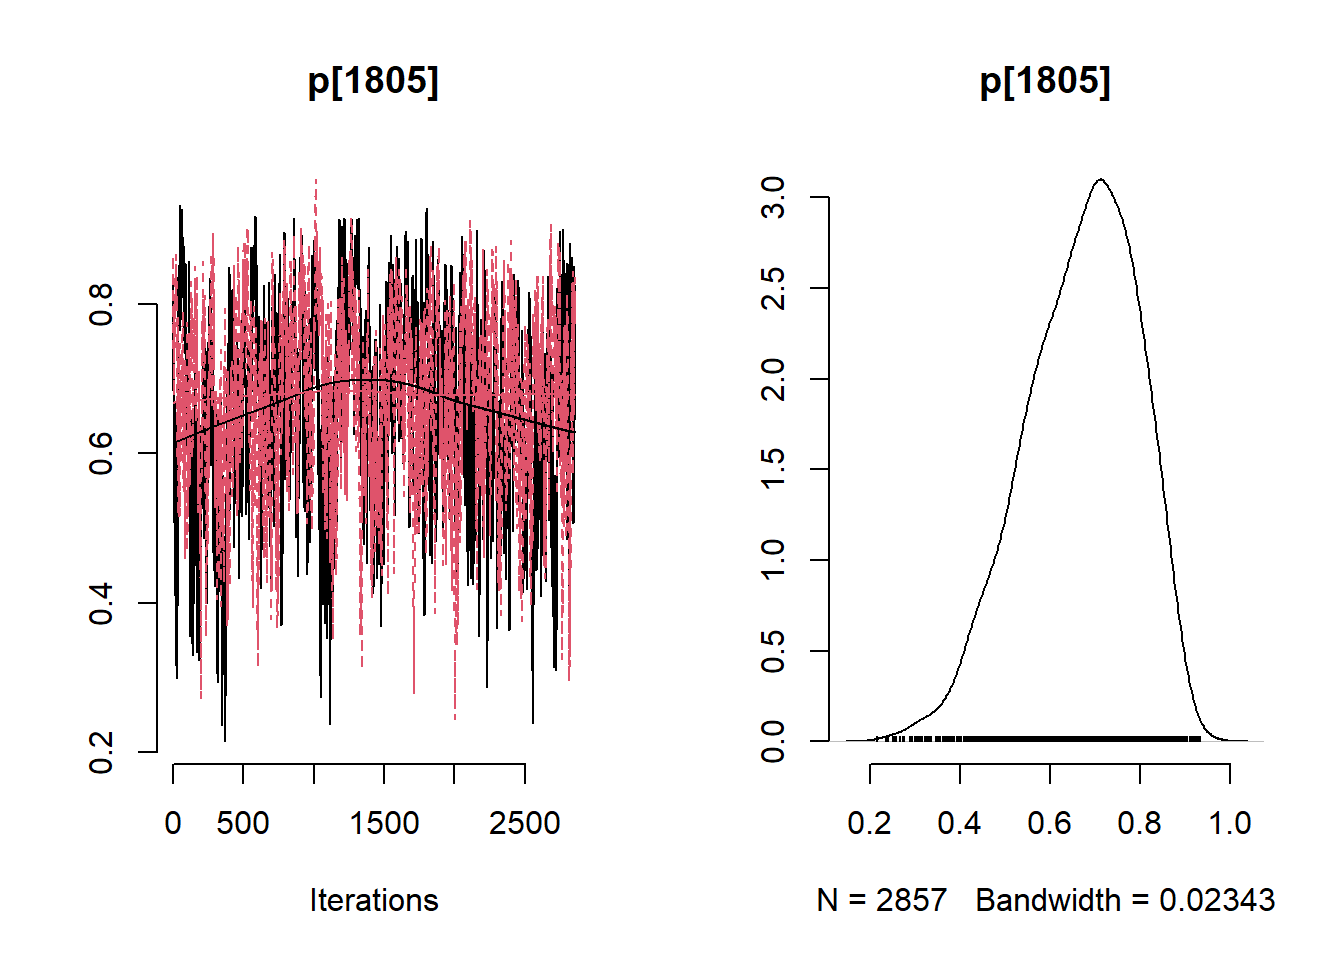
# Get minimum effective size (ESS) and which variable has the min ESS
min(coda::effectiveSize(post_samples$samples))
## [1] 121.2351mcmc_variable_names <- colnames(post_samples$samples$chain1)
mcmc_variable_names[which(coda::effectiveSize(post_samples$samples) == min(coda::effectiveSize(post_samples$samples)))]## [1] "b[7]"# Extract samples
variables <- c("b0", "b[1]", "b[2]", "b[3]", "b[4]", "b[5]", "b[6]", "b[7]", "b[8]", "b[9]" ,"sigma", "phi")
summary_nimble <- post_samples$summary$all.chains
summary_nimble[variables,]## Mean Median St.Dev. 95%CI_low 95%CI_upp
## b0 0.3315201138 0.3392450269 0.2505843962 -0.1729623331 0.8081442858
## b[1] 0.0006860043 0.0006835488 0.0001234595 0.0004431429 0.0009273262
## b[2] -0.3896279125 -0.3888672550 0.1560999545 -0.7048920797 -0.0819548994
## b[3] -0.3757735359 -0.3769547462 0.2116118487 -0.7882866024 0.0385847122
## b[4] 0.0442854311 0.0440496333 0.0178257390 0.0087224925 0.0792046195
## b[5] -0.2100219775 -0.2056276065 0.2483450907 -0.7052031402 0.2462629975
## b[6] -0.5000700991 -0.4943813970 0.3424221174 -1.2308098244 0.1291118929
## b[7] -1.3233823781 -1.3263073092 0.2858536435 -1.8703937606 -0.7468568056
## b[8] -0.7908411531 -0.7987714491 0.4042487749 -1.5835167007 0.0305095920
## b[9] 0.0352274728 0.0345586394 0.4167655576 -0.7596146680 0.8762673597
## sigma 0.7364758452 0.7317618930 0.1031994687 0.5487828612 0.9489075739
## phi 1.2621830848 1.1370656814 0.5930172725 0.5070952884 2.7332364751# Plot posterior summary for the spatial random effect by village
post_summary <- post_samples$summary$all.chains
post_sum_S <-
as.data.frame(post_summary) |> tibble::rownames_to_column() |>
filter(str_detect(rowname, "S")) |>
dplyr::select(rowname, `95%CI_low`, Mean, `95%CI_upp`) |>
mutate(village = gsub(".*?([0-9]+).*", "\\1", rowname))
post_sum_S$village <-
factor(post_sum_S$village , levels = 1:65)
ggplot(data = post_sum_S, aes(x = village)) +
geom_pointrange(aes(ymin = `95%CI_low`, ymax = `95%CI_upp`, y = Mean)) +
geom_hline(yintercept = 0, linetype = "dotted") +
scale_x_discrete(
breaks = post_sum_S$village[seq(1, length(post_sum_S$village), by = 5)]) +
theme_classic() + ylab("") + xlab("village") +
ggtitle("Posterior summary spatial random effect by village")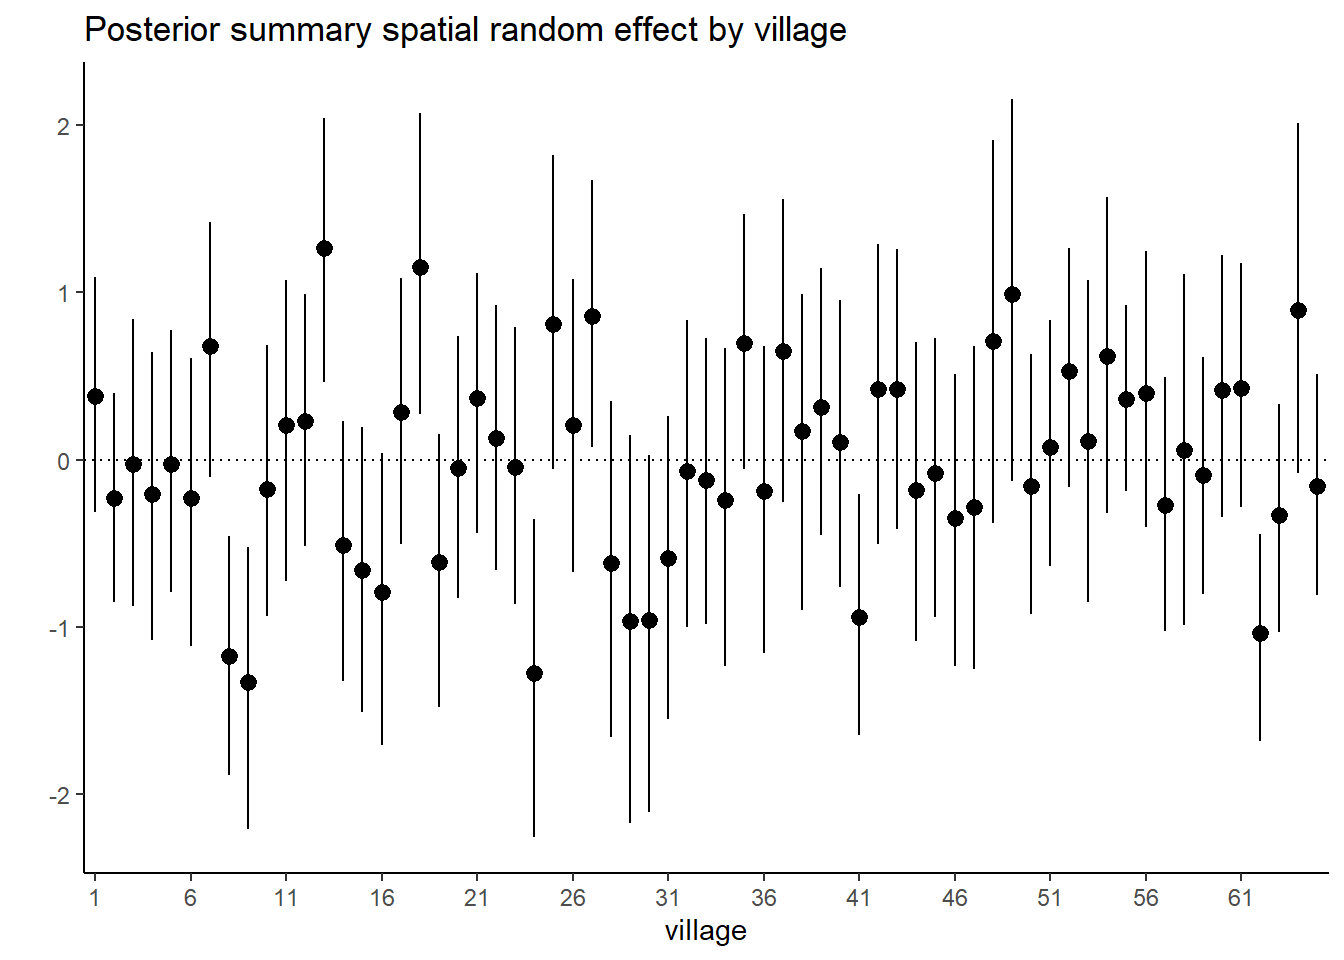
Stan
data {
  int<lower=1> n; //  number of children
  int<lower=1> k; // number of covariates
  int N; //  total number of villages
  int y[n]; //  tests
  matrix[N,N] dist_matrix; //  distance matrix
  matrix[n, k] X; // matrix with covariates
  int index_village[n];
}

parameters {
  real<lower=0> phi_inv;
  real<lower=0> sigma;
  vector[N] S; // spatial random effect
  vector[k] betas;
  real beta0;
}

transformed parameters {
  // vector[n] p = inv_logit(logit_p);
  real sigma_sq = square(sigma);
  real<lower=0> phi = 1/phi_inv;
}

model {
  matrix[N, N] L;
  matrix[N, N] Sigma;
  vector[N] zeroes; // vector of zeroes
  vector[n] logit_p;

 for(i in 1:(N-1)){
   for(j in (i+1):N){
     //Sigma[i,j] = sigma_sq*exp(-dist_matrix[i,j]/phi);
     Sigma[i,j] = sigma_sq*(1 + (sqrt(3)*dist_matrix[i,j])/phi) * exp(-sqrt(3)*dist_matrix[i,j] / phi);
     Sigma[j,i] = Sigma[i,j];
   }
 }
   // diagonal elements covariances
for(i in 1:N){
  Sigma[i,i] = sigma_sq;
}

// sample spatial random effect
  L = cholesky_decompose(Sigma);
  zeroes = rep_vector(0, N);
  S ~ multi_normal_cholesky(zeroes, L);

  for(i in 1:n) {
    logit_p[i] = beta0 + X[i,]*betas + S[index_village[i]];
    y[i] ~ binomial_logit(1, logit_p[i]);
  }

  beta0 ~ normal(0,10);
  betas ~ normal(0,10);
  phi_inv ~ gamma(5, 5);
  sigma ~ cauchy(0,1);


}
ex.data <- list( n = nrow(gambia), # number of children
k = ncol(X), # number of covariates
N = N, # number of villages
y = gambia$pos, # positive tests
dist_matrix = obs_dist_mat, # distance matrix in km
X = X, # altitude per village
index_village = index_village
)
Example10_14Stan <- stan(
file = "functions/Example10_14.stan",
data = ex.data,
warmup = 15000,
iter = 30000,
chains = 2,
thin = 10,
pars = c("beta0", "betas","sigma", "phi", "S"),
include = TRUE
)#computing WAIC using the package loo
rstan::traceplot(Example10_14Stan, pars = c("beta0","betas","sigma", "phi"))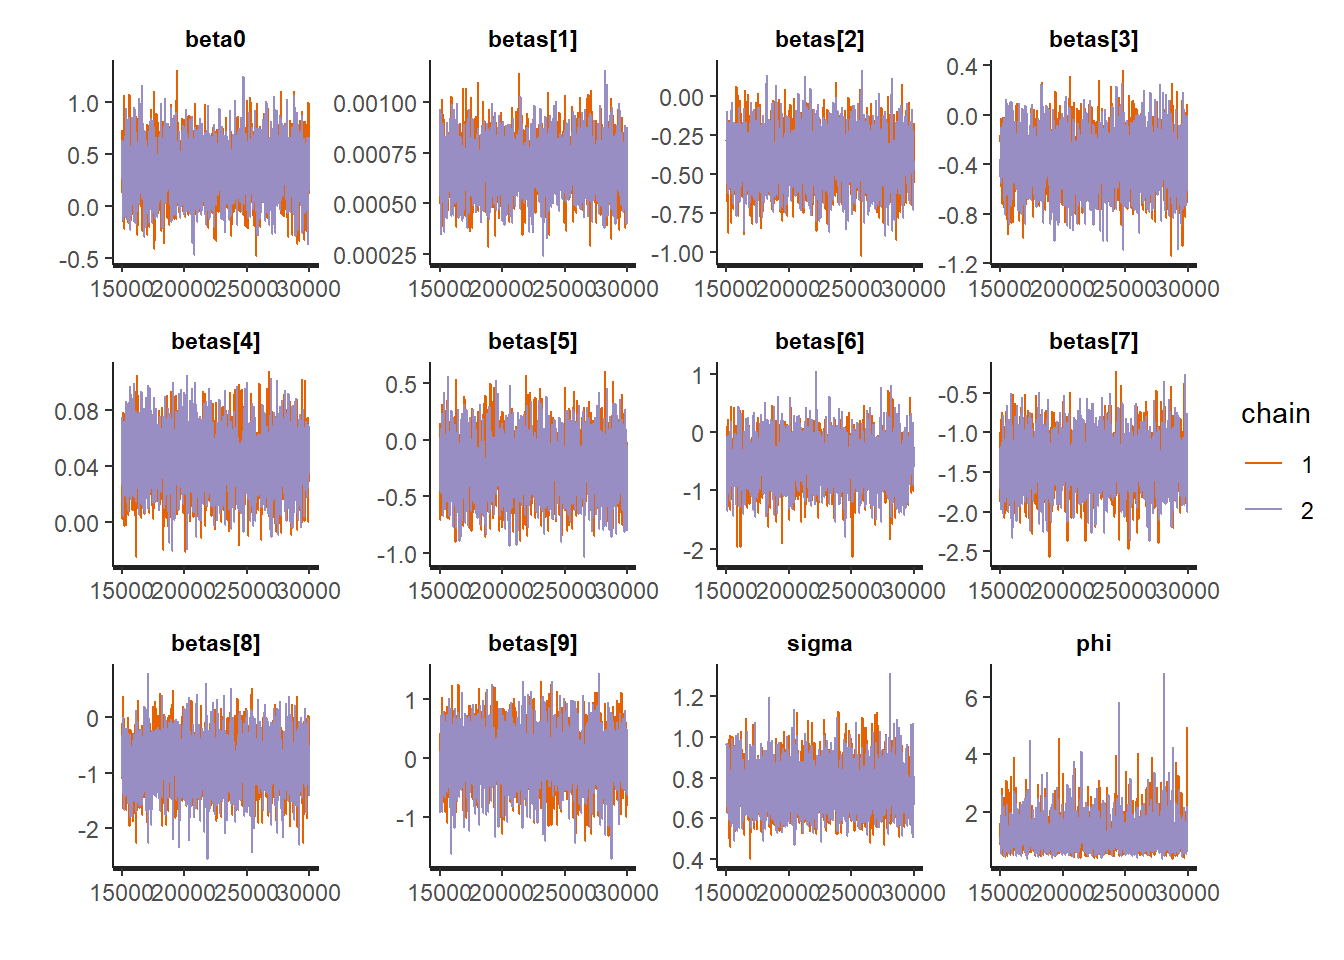
# Extract samples
summary_stan <-
  summary(
    Example10_14Stan,
    pars = c("beta0","betas", "sigma", "phi"),
    probs = c(0.025, 0.975)
  )

summary_stan$summary
## mean se_mean sd 2.5% 97.5%
## beta0 0.3458755538 4.778216e-03 0.2510986221 -0.1362639241 0.8442035273
## betas[1] 0.0006871207 2.273556e-06 0.0001224843 0.0004482812 0.0009307211
## betas[2] -0.3937790344 2.994197e-03 0.1630352170 -0.7217402843 -0.0793440251
## betas[3] -0.3690088984 3.969896e-03 0.2141993706 -0.7771861338 0.0585086866
## betas[4] 0.0441686717 3.655065e-04 0.0204927583 0.0038759447 0.0849912336
## betas[5] -0.2188864063 4.524898e-03 0.2445430055 -0.6915407489 0.2553282584
## betas[6] -0.5146223013 7.075673e-03 0.3790193760 -1.2623443596 0.2154029130
## betas[7] -1.3569507901 5.737837e-03 0.3113742252 -1.9752438918 -0.7549112373
## betas[8] -0.8086446199 7.945203e-03 0.4441463825 -1.6942523608 0.0389549590
## betas[9] 0.0102733351 8.134941e-03 0.4361173159 -0.8699648369 0.8558910589
## sigma 0.7474663299 2.086654e-03 0.1094484302 0.5576156752 0.9798656966
## phi 1.2278687030 1.059571e-02 0.5680543393 0.5086054757 2.6412794837
## n_eff Rhat
## beta0 2761.576 0.9994923
## betas[1] 2902.347 0.9995322
## betas[2] 2964.847 0.9994596
## betas[3] 2911.241 0.9993715
## betas[4] 3143.479 1.0007034
## betas[5] 2920.740 0.9994372
## betas[6] 2869.375 0.9999332
## betas[7] 2944.889 0.9995635
## betas[8] 3124.944 0.9998981
## betas[9] 2874.074 0.9998750
## sigma 2751.176 0.9995793
## phi 2874.216 0.9995888S_summary <-
summary(Example10_14Stan, pars = c("S"))$summary
S_summary_df <- data.frame(S_summary) |>
tibble::rownames_to_column() |>
filter(rowname %in% paste0("S[", 1:65, "]")) |>
mutate(village = 1:65) |>
dplyr::select(mean, X2.5., X97.5., village)
S_summary_df$village <-
factor(S_summary_df$village , levels = 1:65)
ggplot(S_summary_df, aes(x = village, group = 1)) +
geom_pointrange(aes(ymin = X2.5., ymax = X97.5., y = mean)) +
geom_hline(yintercept = 0, linetype = "dotted") +
scale_x_discrete(
breaks = S_summary_df$village[seq(1, length(S_summary_df$village), by = 5)]) +
theme_classic() + ylab("") + xlab("village") +
ggtitle("Posterior summary spatial random effect by village")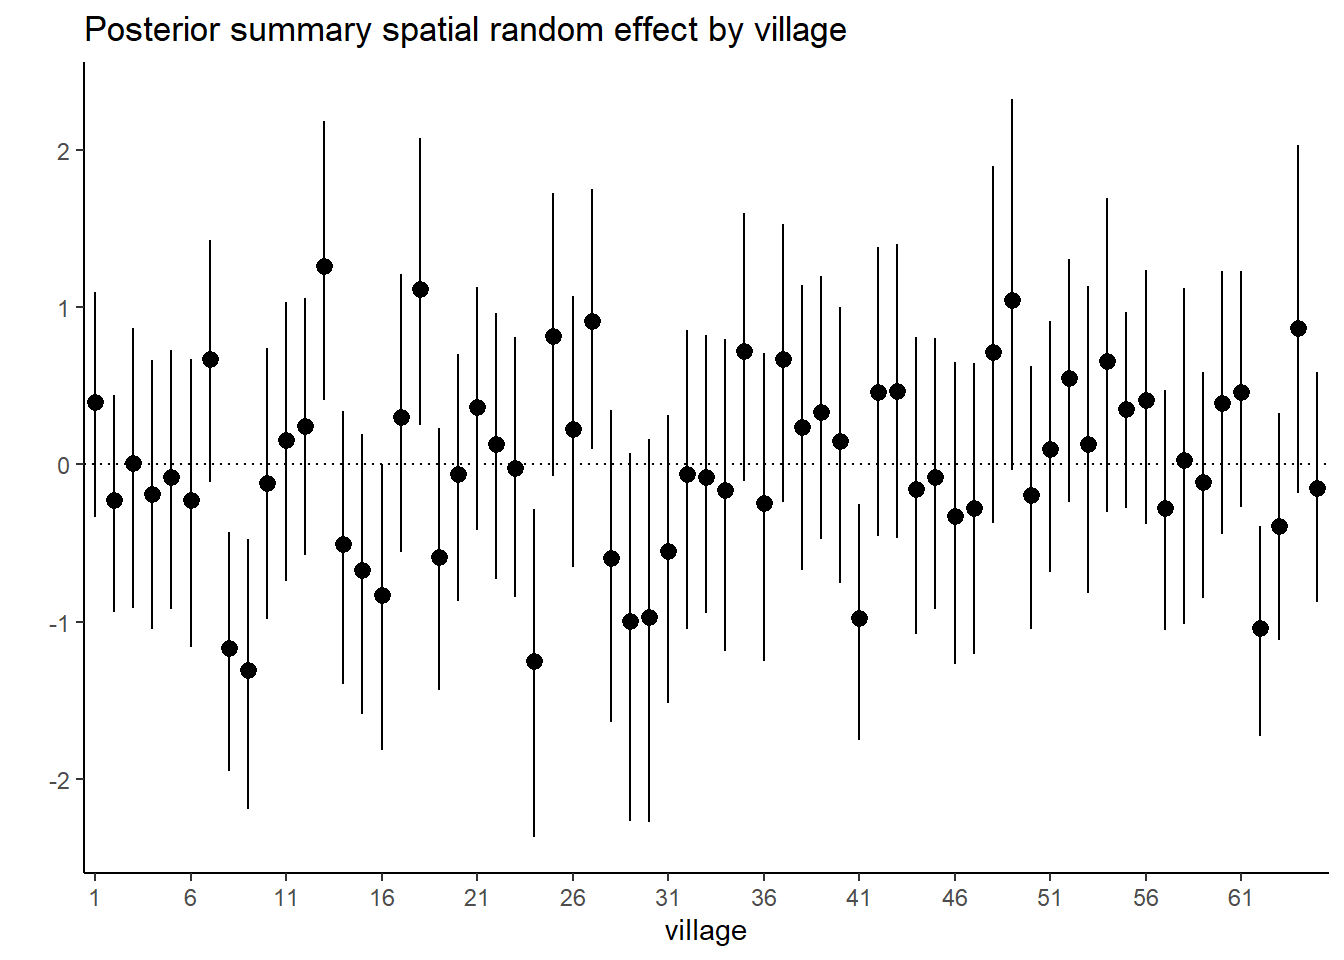
Supplementary Material
Example: Analysis of benzene concentrations across Montreal, QC, Canada
Map the locations of the monitoring stations in Montreal.
This example uses the montreal_benzene_apr.csv
library(cowplot)
library(geoR)
library(leaflet)
library(spdep)
# Load data on benzene concentration in Montreal
benzene <- read.csv("data/voc/montreal_benzene_apr.csv")
# TODO: Add description of the data, this is the April campaign
# create a new variable in "sp" format and define coordinates
benzene_geo <- benzene
coordinates(benzene_geo) <- ~ lon + lat
proj4string(benzene_geo) <- CRS("+proj=longlat +datum=WGS84")
# create map with location dots marked on it in
range_values <- range(benzene$Benzene)
mybins <- seq(range_values[1], range_values[2], length.out = 5)
mypalette <- colorBin(palette="inferno", domain=benzene$Benzene,
na.color="transparent", bins=mybins)
leaflet( data = benzene) |>
addTiles() |>
addProviderTiles("Esri.WorldImagery") |>
addCircleMarkers(
~ lon,
~ lat,
fillOpacity = 0.8, color="orange",
fillColor = ~ mypalette(Benzene),
opacity = 5,
radius = ~Benzene*4,
stroke = FALSE) |>
addLegend( pal=mypalette, values=~Benzene,
opacity=0.9, title = "Benzene concentration",
position = "bottomright" )Using the geoR package we can also plot the following:
- the locations of the sampling sites
- the concentrations of ozone in relation to the x and y coordinates
- and a histogram of the concentrations indicating the distribution of concentrations together with an estimate of the density.
# convert data to utm coordinates
benzene_utm <- spTransform(benzene_geo,
                           CRS("+proj=utm +zone=18 +ellps=WGS72"))
# Save the utm as a data frame
benzene_utm_df <- as.data.frame(benzene_utm)
colnames(benzene_utm_df) <- c("Benzene", "X", "Y")
# Save as geodata to generate the geodata plot
benzene_geodata <- as.geodata(benzene_utm_df,
                              coords.col = 2:3, data.col = 1)
plot(benzene_geodata)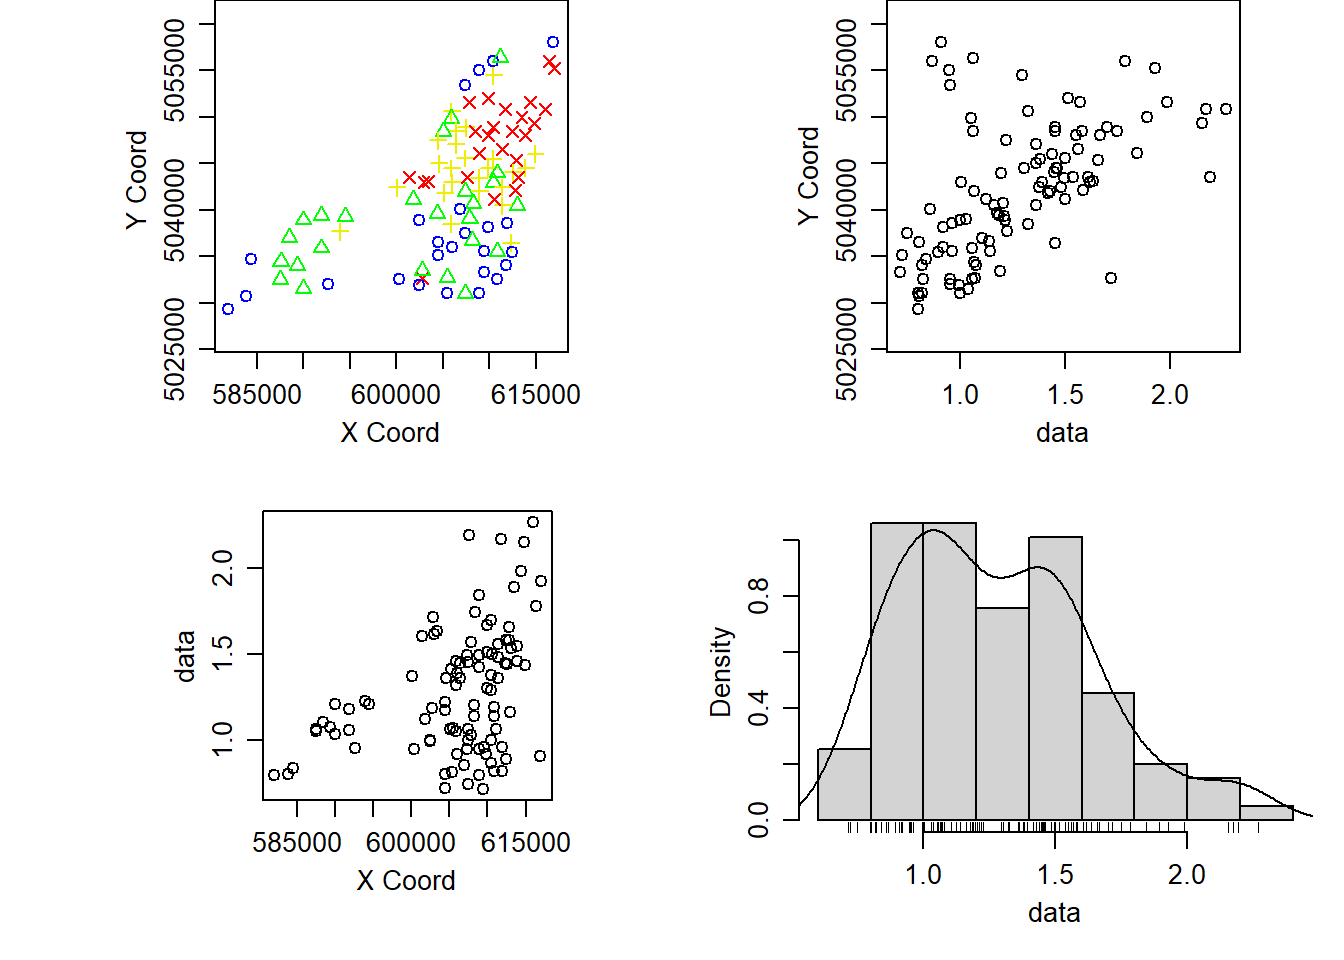
Extra 10.2: Examining the log concentrations of benzene in Montreal
# Histogram for the log of the benzene concentration
par(mfrow = c(1, 2))
log_histogram <-
  hist(log(benzene$Benzene), main = "", xlab = "log(Benzene)")
qqnorm(log(benzene$Benzene), bty = "n")
qqline(log(benzene$Benzene))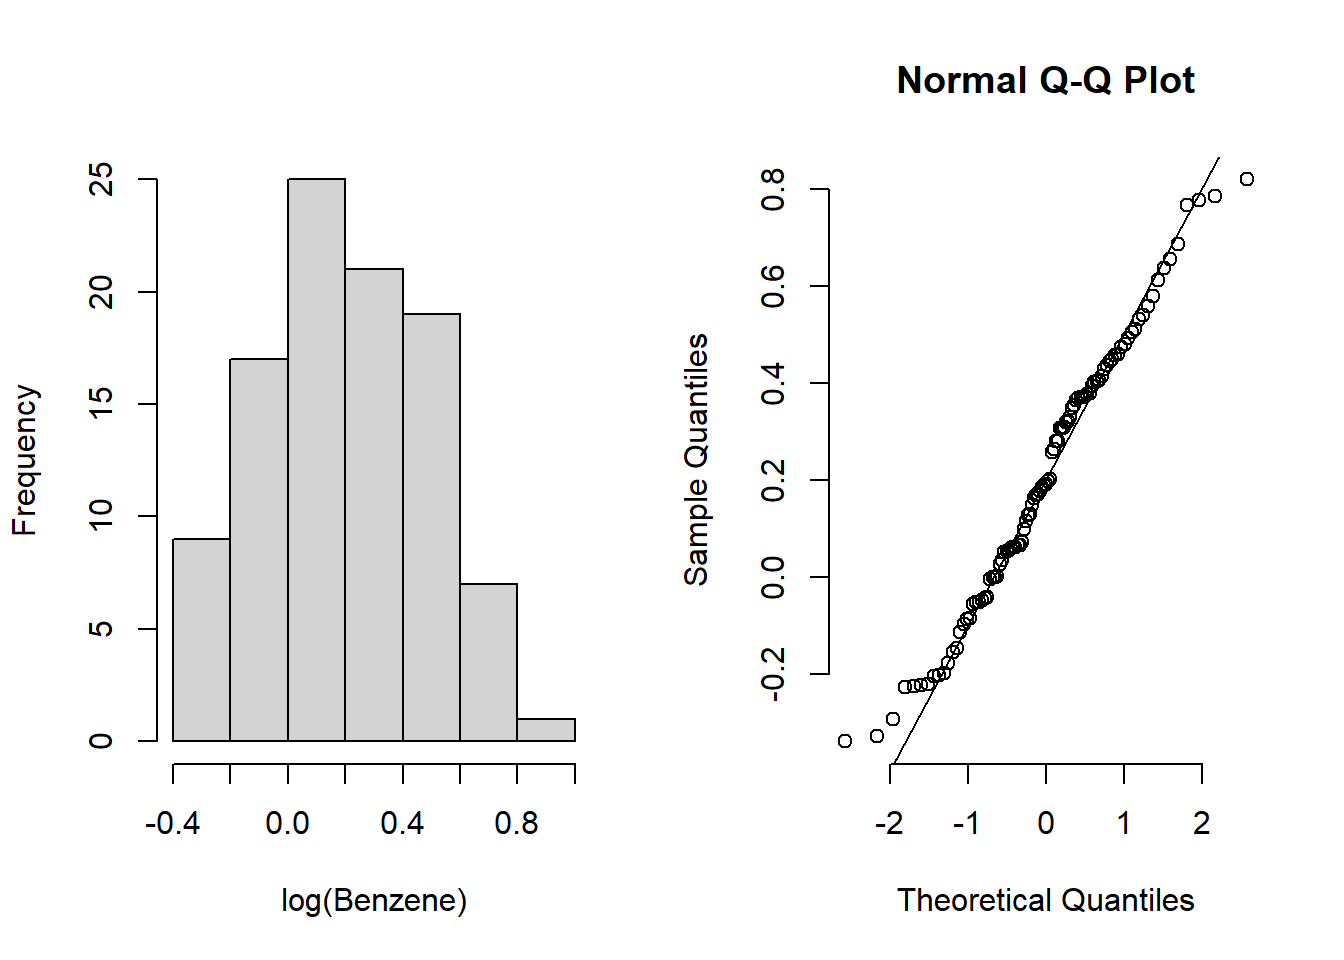
Extra 10.5: Variogram
library(gstat)
benzene_utm_geo <- benzene_utm_df
# get the coordinates in kms and turn into a Spatial object
benzene_utm_geo[,c("X", "Y")] <- benzene_utm_geo[,c("X", "Y")]/1000
coordinates(benzene_utm_geo) <- ~ X + Y
# Estimate variogram intercept only
benzene_inter_vgm <- variogram(log(Benzene) ~ 1,
                               data = benzene_utm_geo,
                               cutoff = 20,# cutoff distance
                               width = 20 / 10) # bins width


benzene_inter_vgm_fit <- fit.variogram(benzene_inter_vgm,
                                       model = vgm(0.1, "Exp", 15, 0.02))

benzene_inter_vgm_fit
## model psill range
## 1 Nug 0.01616521 0.00000
## 2 Exp 0.17301314 23.97153# Estimate variogram using coordinates
benzene_vgm <- variogram(log(Benzene) ~ X + Y,
data = benzene_utm_geo,
cutoff = 20, # cutoff distance
width = 20 / 10) # bins width
benzene_vgm_fit <- fit.variogram(benzene_vgm, model = vgm(0.1, "Exp", 3, 0.02))
benzene_vgm_fit## model psill range
## 1 Nug 0.01638881 0.000000
## 2 Exp 0.05598753 7.365469plot_inter_variog <- plot(benzene_inter_vgm, benzene_inter_vgm_fit, bty = "n")
plot_coord_variog <- plot(benzene_vgm, benzene_vgm_fit, bty = "n")
plot_grid(plot_inter_variog, plot_coord_variog, labels = "auto")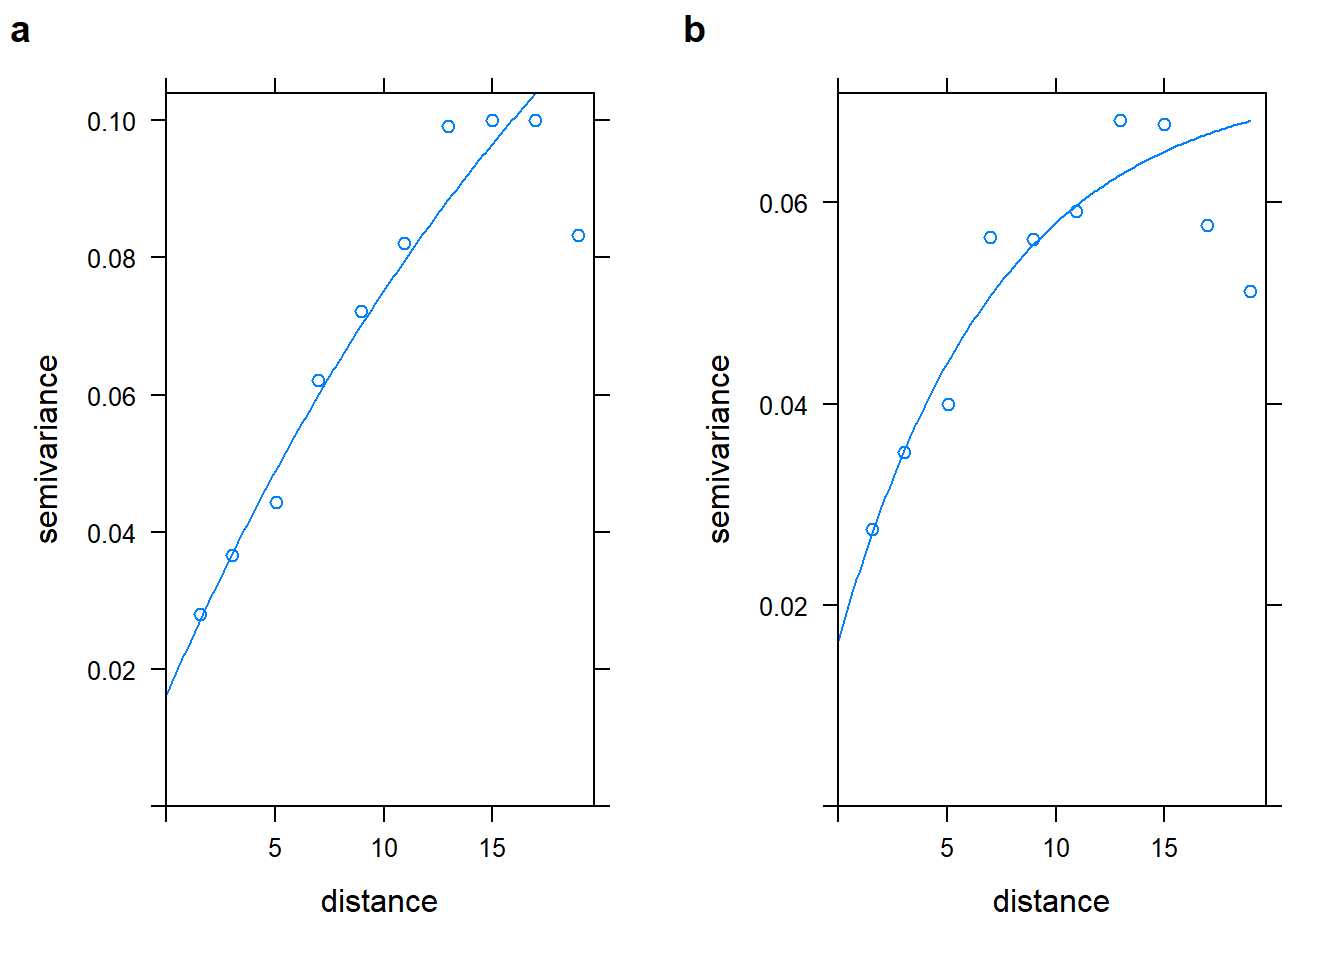
Extra 10.6 Basic spatial modelling and prediction of benzene in Montreal
# Generate grid
MtlPred <- expand.grid(seq (580, 615 , 0.5),
                             seq (5020, 5060 , 0.5) )
# change names grid
names(MtlPred)[ names(MtlPred)=="Var1"] <- "X"
names(MtlPred)[ names(MtlPred)=="Var2"] <- "Y"
# make the grid a Spatial object
coordinates (MtlPred) = ~ X + Y
gridded(MtlPred) = TRUE
# define the model based on the variogram fit from the previous example
mod <- vgm (0.053 , "Exp", 5.54, 0.0122)
# use ordinary kriging to predict values in the grid
x <- krige(log(Benzene) ~ X + Y, benzene_utm_geo , MtlPred , model = mod )
## [using universal kriging]# Plot the ordinary kriging predictions and their variance
monitor_loc <- list('sp.points', benzene_utm_geo, pch=19, cex=.8, col='cornsilk4')
krig_pred <-
spplot (
x["var1.pred"],
main = "Ordinary kriging predictions ",
col.regions = viridis::plasma(60),
sp.layout = list(monitor_loc),
at = seq(-0.3, 0.8, 0.02)
)
krig_var <-
spplot (
x["var1.var"],
main = "Ordinary kriging variance ",
col.regions = viridis::plasma(60),
sp.layout = list(monitor_loc),
at = seq(0, 0.2, 0.01)
)
plot_grid(krig_pred, krig_var, labels = "auto")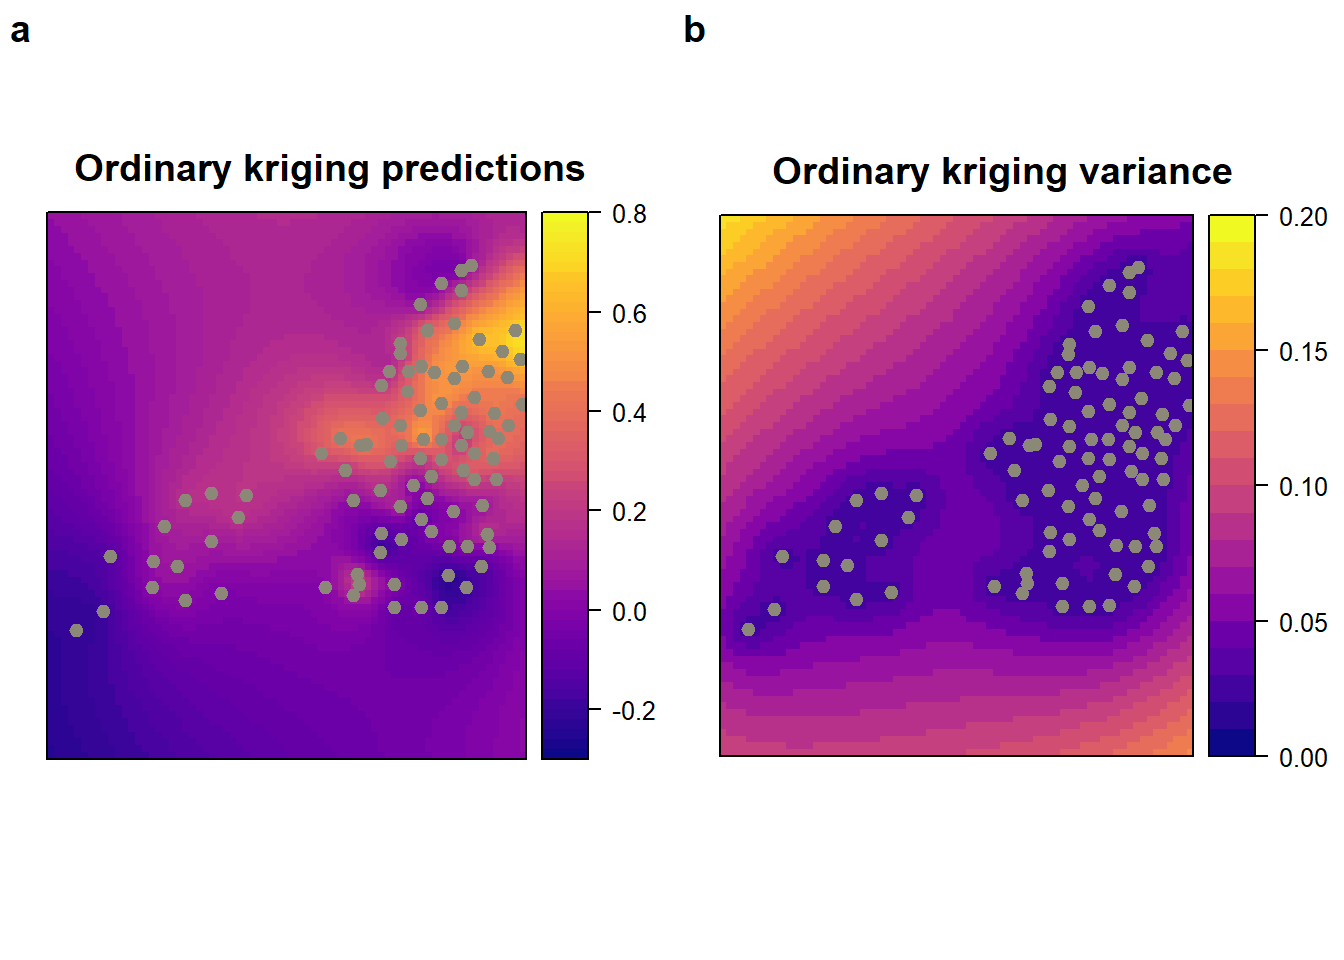
Extra 10.8 Spatial modelling of Benzene in Montreal
This example uses the montreal_benzene_apr.csv
Nimble
library(coda)
library(geoR)
library(magrittr)
library(nimble)
library(spdep)
library(tidyverse)
library(tidybayes)
# Load data on benzene concentration in Montreal
benzene <- read.csv("data/voc/montreal_benzene_apr.csv")
# create a new variable in "sp" format and define coordinates
benzene_geo <- benzene
coordinates(benzene_geo) <- ~ lon + lat
proj4string(benzene_geo) <- CRS("+proj=longlat +datum=WGS84")
benzene_utm <- spTransform(benzene_geo,
CRS("+proj=utm +zone=18 +ellps=WGS72"))
# Save the utm as a data frame
benzene_utm_df <- as.data.frame(benzene_utm)
# Change coordinates to kilometers and observations to the log scale
Mtl_benzene_sample <-
data.frame(
y = log(benzene_utm_df$Benzene),
easting = benzene_utm_df$lon / 1000,
northing = benzene_utm_df$lat / 1000
)
# Compute the distance matrix
obsCoords <- unname(as.matrix(Mtl_benzene_sample[,c("easting", "northing")]))
obsDist <- fields::rdist(obsCoords)Extra10_9Code <- nimbleCode ({
# Covariance matrix spatial effect
Sigma[1:n, 1:n] <-
sigma_sq * exp(-distMatrix[1:n, 1:n] / phi) + tau_sq * identityMatrix(d = n)
for (site in 1:n) {
mean.site[site] <-
beta0 + beta1 * easting[site] + beta2 * northing[site]
}
y[1:n] ~ dmnorm(mean.site[1:n], cov = Sigma[1:n, 1:n])
# Set up the priors for the spatial model
sigma ~ T(dt(mu = 0, sigma = 1, df = 1), 0, Inf)
sigma_sq <- sigma^2
tau ~ T(dt(mu = 0, sigma = 1, df = 1), 0, Inf)
tau_sq <- tau^2
phi_inv ~ dgamma(shape = 5, rate = 5)
phi <- 1 / phi_inv
# prior for the coefficients
beta0 ~ dnorm (0, 10)
beta1 ~ dnorm (0, 10)
beta2 ~ dnorm (0, 10)
})
# Define the constants, data, parameters and initial values
set.seed(1)
easting_scaled <- as.vector(scale(Mtl_benzene_sample$easting))
northing_scaled <- as.vector(scale(Mtl_benzene_sample$northing))
constants <-
list(n = nrow(Mtl_benzene_sample))
ex.data <-
list(y = Mtl_benzene_sample$y,
easting = easting_scaled,
northing = northing_scaled,
distMatrix = obsDist)
params <- c( "beta0", "beta1","beta2", "phi", "tau", "sigma", "tau_sq", "sigma_sq")
inits <- list( sigma = 0.1, phi_inv = 6/max(obsDist), tau = 0.1)
# Run model in nimble
start_time <- Sys.time()
mcmc.out <- nimbleMCMC(
code = Extra10_9Code,
constants = constants,
data = ex.data,
inits = inits,
monitors = params,
niter = 40000,
nburnin = 20000,
thin = 14,
WAIC = TRUE,
nchains = 2,
summary = TRUE,
samplesAsCodaMCMC = TRUE
)
end_time <- Sys.time()
run_time <- end_time - start_time
run_time## nimbleList object of type waicList
## Field "WAIC":
## [1] -32.37684
## Field "lppd":
## [1] 19.03084
## Field "pWAIC":
## [1] 2.842421## [1] 985.2176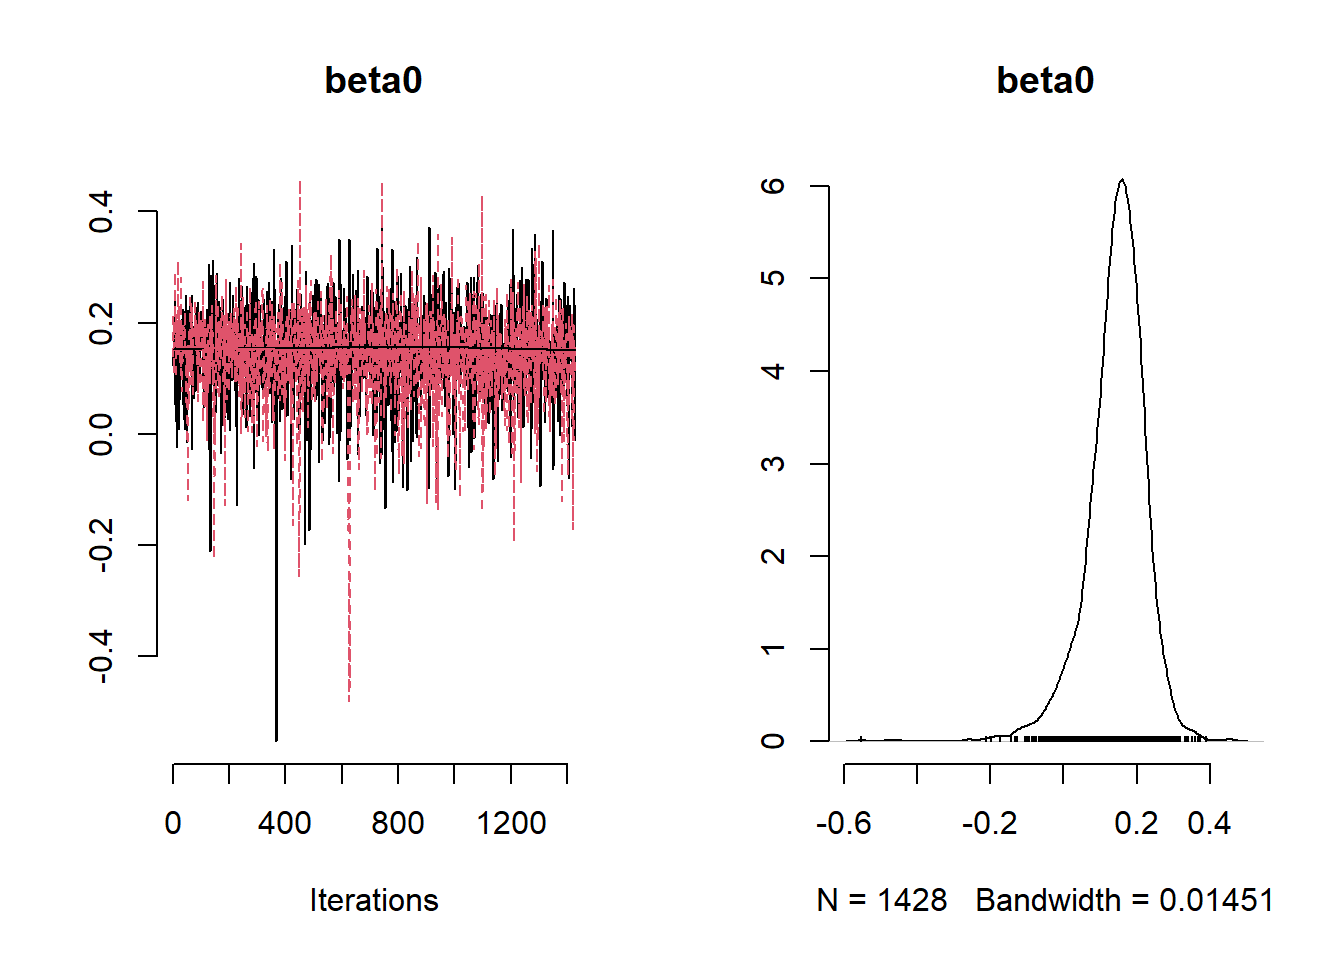
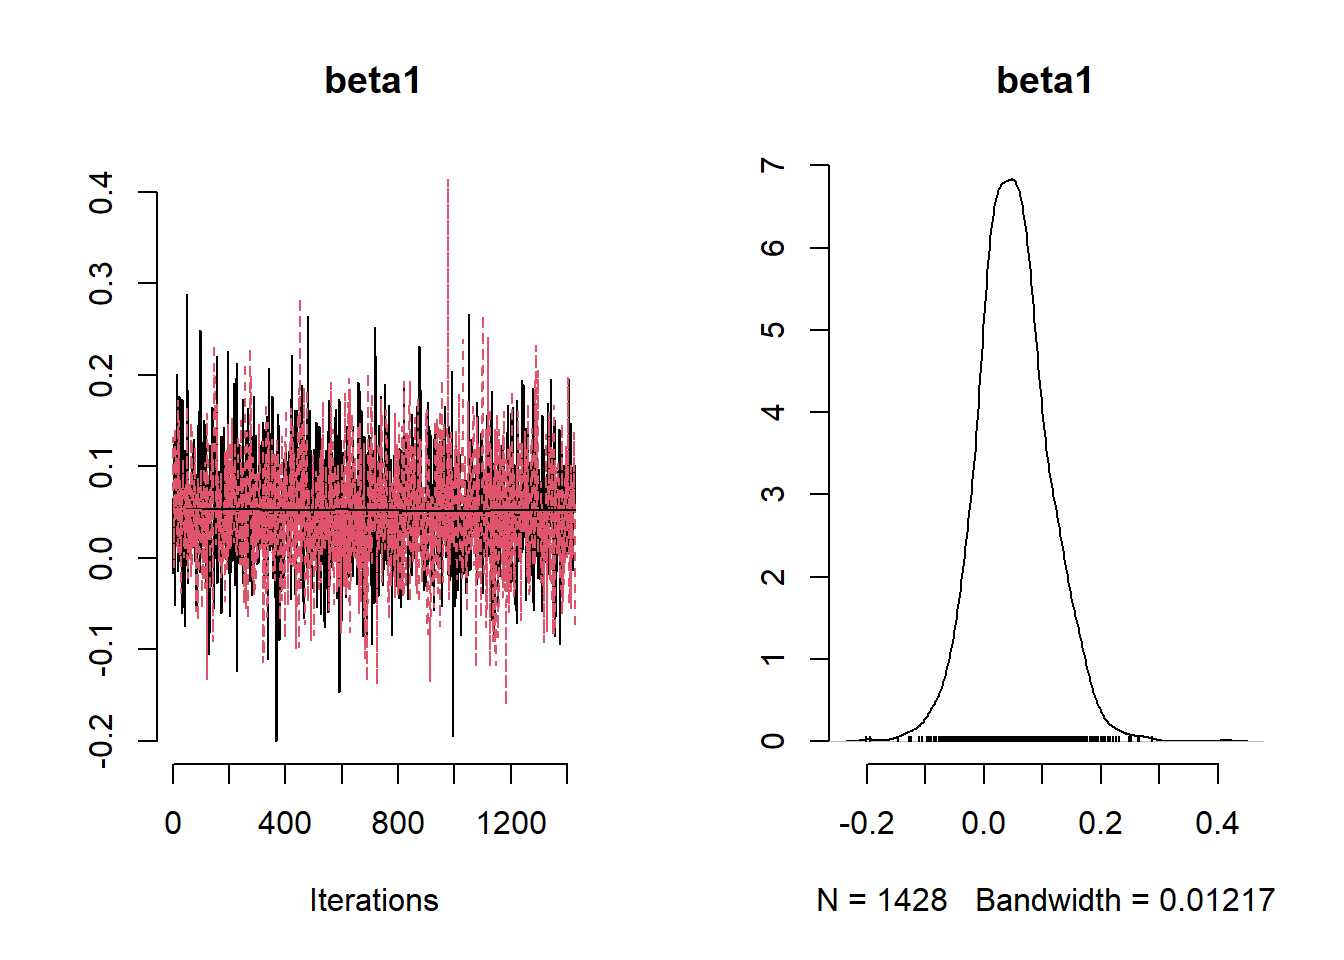
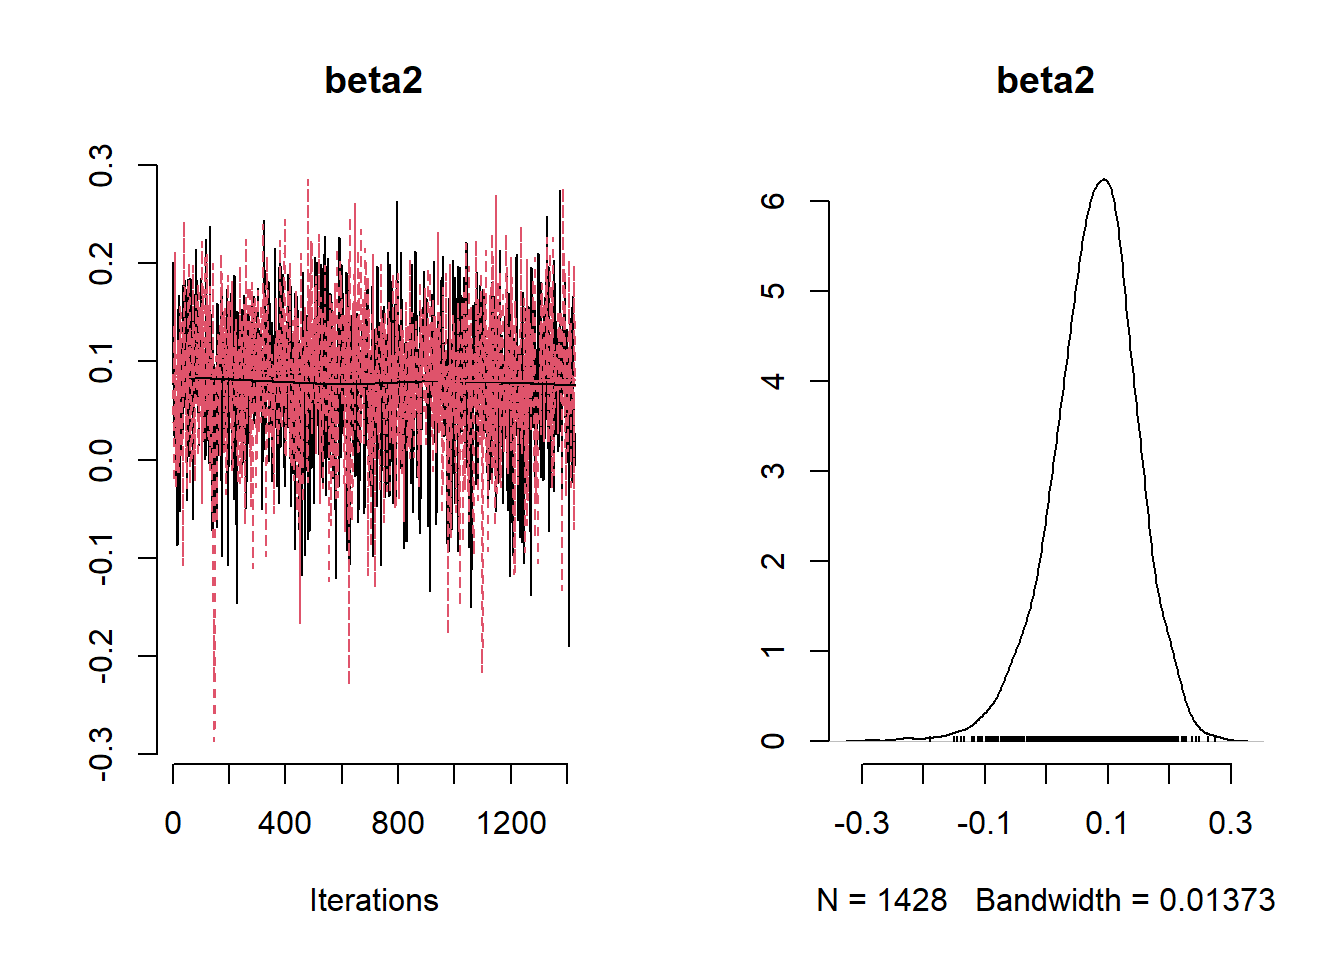
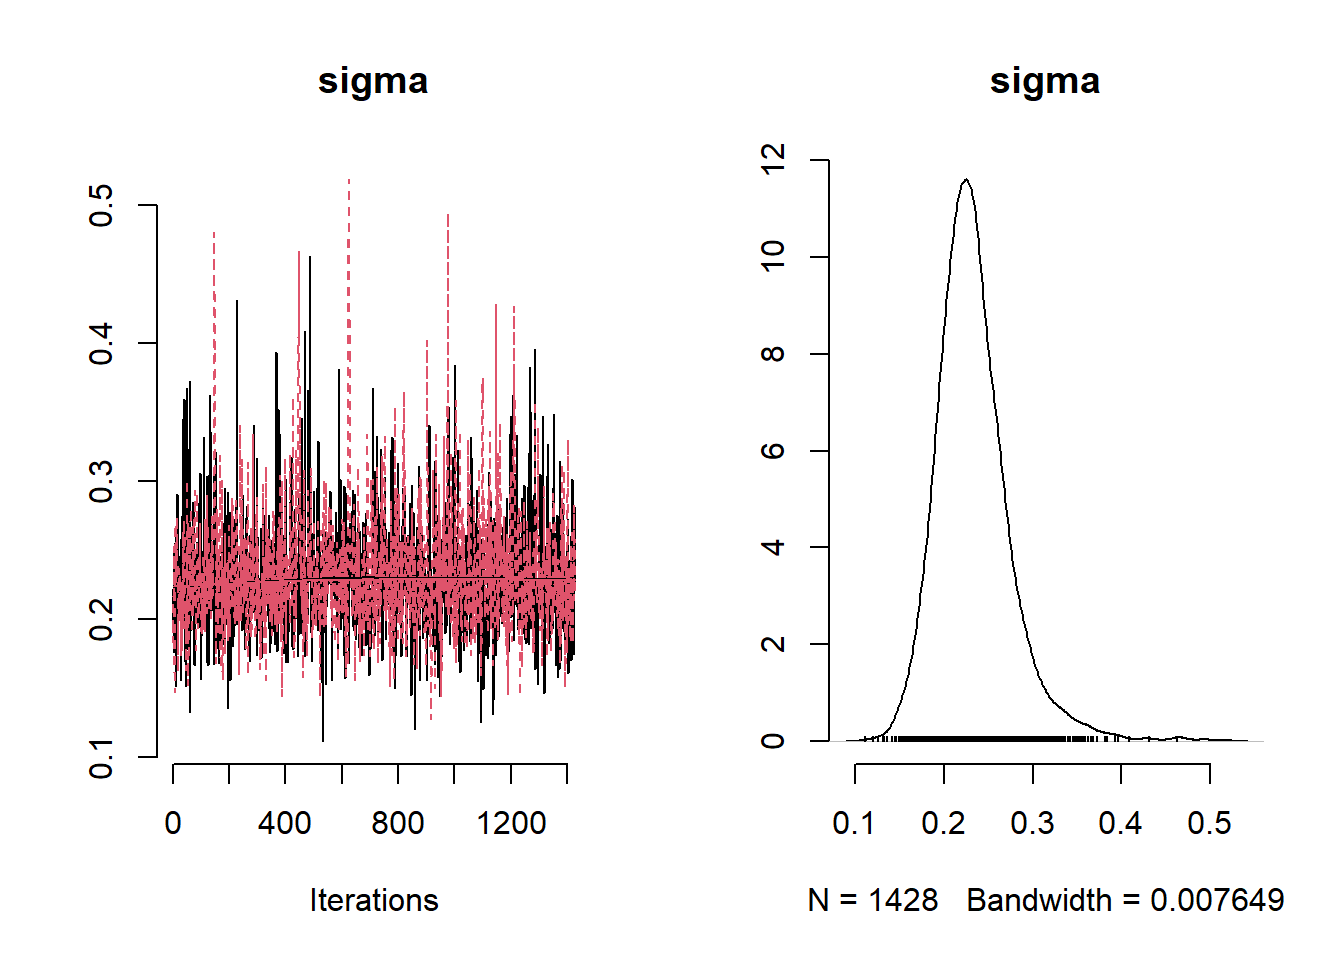
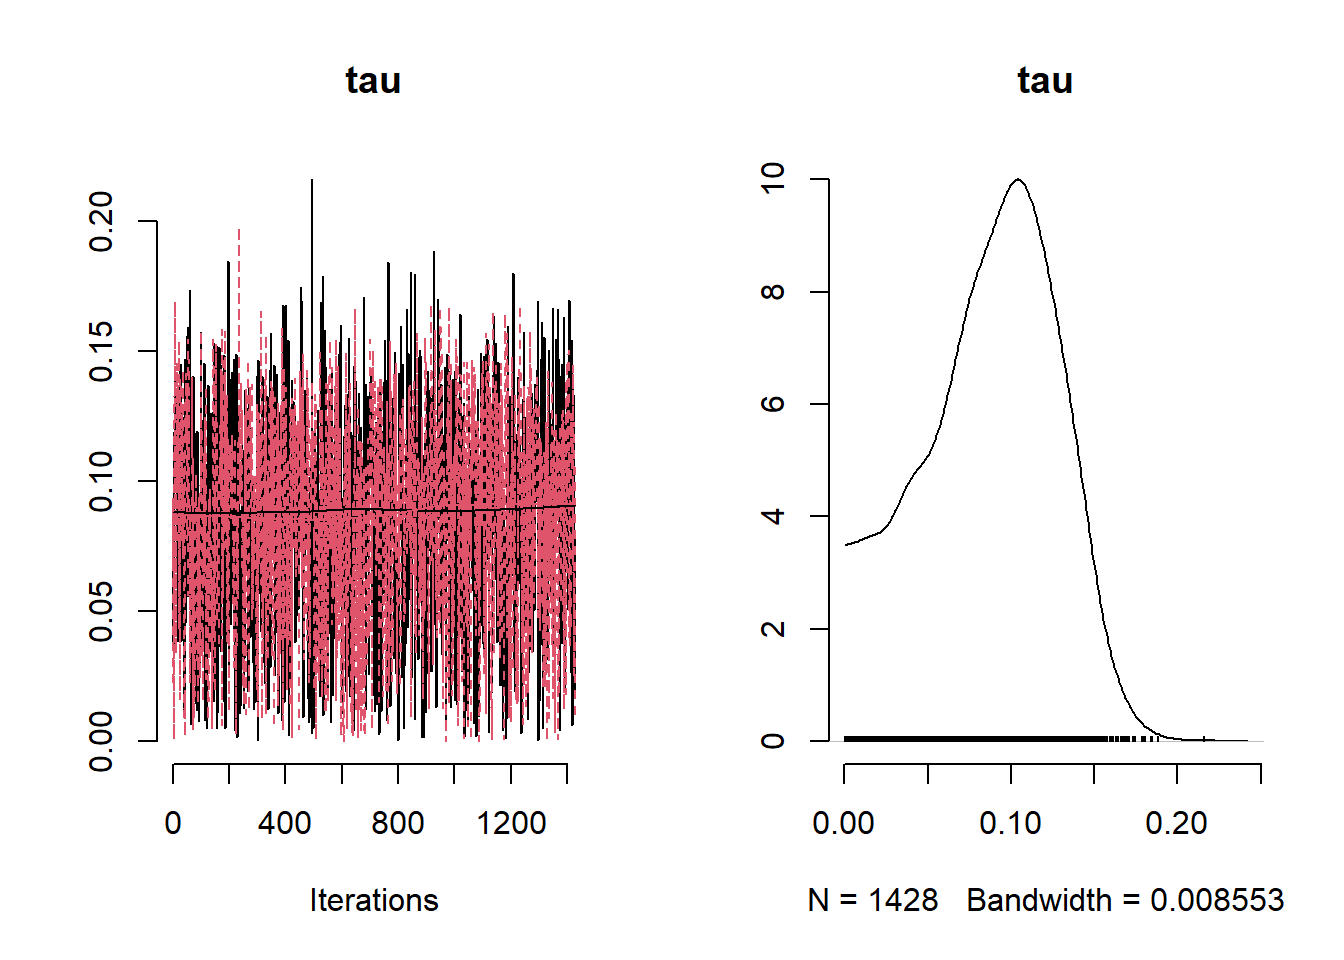
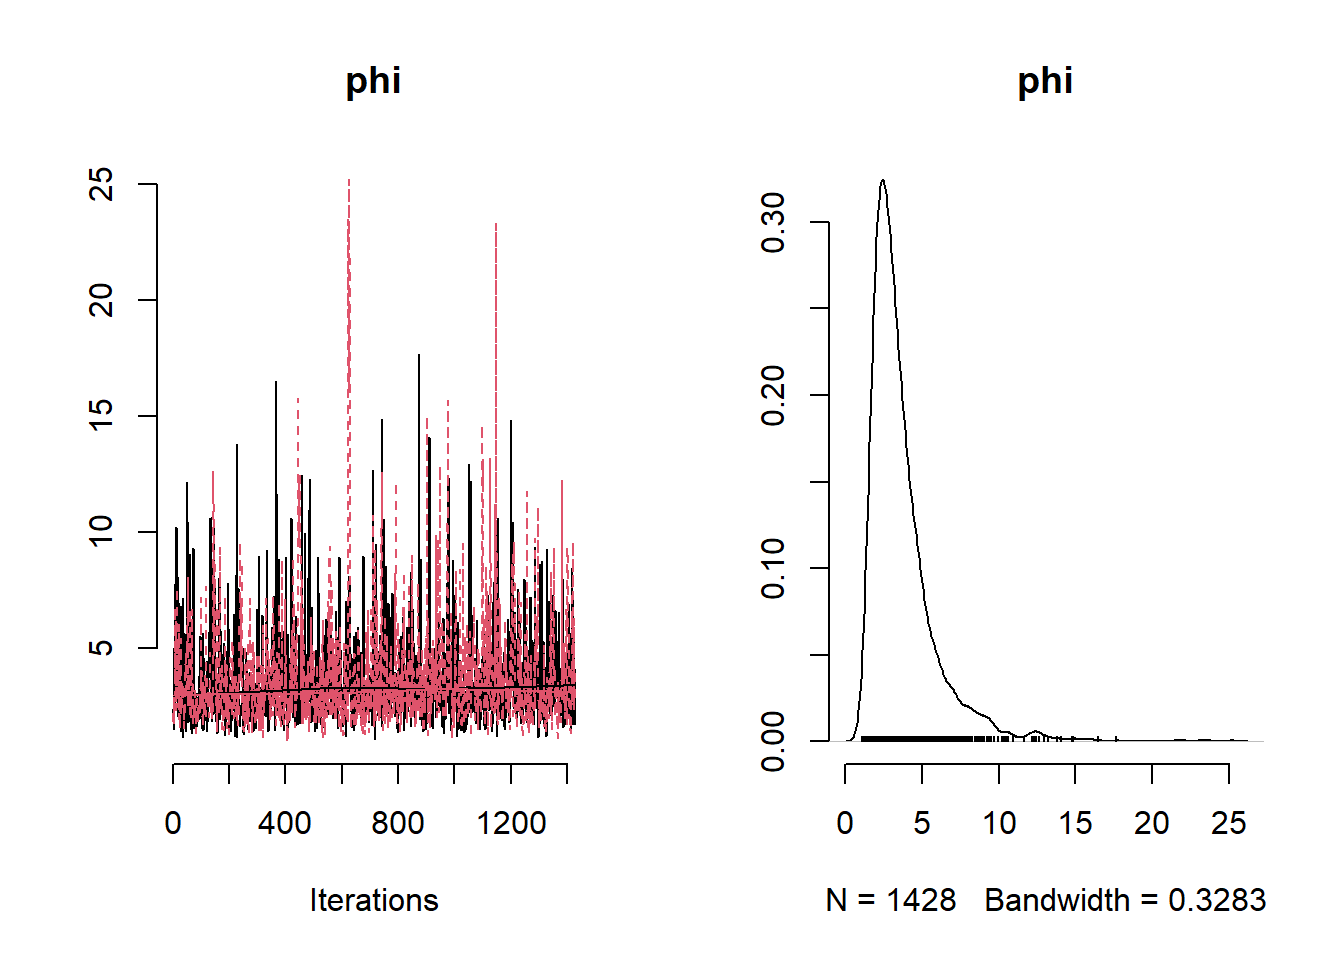
##                 Mean     Median     St.Dev.     95%CI_low  95%CI_upp
## beta0    0.143589662 0.15187505 0.081381727 -4.284934e-02 0.27866526
## beta1    0.051028164 0.04806334 0.060619017 -6.338295e-02 0.17328888
## beta2    0.077775628 0.08250220 0.068519017 -7.013084e-02 0.20323633
## sigma_sq 0.056087887 0.05202343 0.022624353  2.770244e-02 0.11140808
## tau_sq   0.009128758 0.00841011 0.006709036  5.744089e-05 0.02380432
## phi      3.697646345 3.09115863 2.228726265  1.463844e+00 9.40053808
# Obtain coordinates for predictions
# note that we are using the same coordinates as the one generated for
# the kriging example
Mtl_centroids_df <- as.data.frame(MtlPred)
predCoords <- unname(as.matrix(Mtl_centroids_df))Following the posterior predictive distribution we have to define a model for the predictions.
# Extract samples from nimble model
tidy_post_samples <- mcmc.out$samples |> tidy_draws()
# Extract posterior samples for each of the parameters of interest
post_beta0 <- tidy_post_samples$beta0
post_beta1 <- tidy_post_samples$beta1
post_beta2 <- tidy_post_samples$beta2
post_sigmasq <- tidy_post_samples$sigma_sq
post_phi <- tidy_post_samples$phi
post_tausq <- tidy_post_samples$tau_sq
# Scale coordinates for predictive locations
predCoords_sc <- predCoords
predCoords_sc[,1] <-
(predCoords_sc[,1] - mean(Mtl_benzene_sample$easting)) / sd(Mtl_benzene_sample$easting)
predCoords_sc[,2] <-
(predCoords_sc[,2] - mean(Mtl_benzene_sample$northing)) / sd(Mtl_benzene_sample$northing)
n0 <- nrow(predCoords_sc)
L <- length(post_tausq)
obsMu <- cbind(1, easting_scaled, northing_scaled) %*% t(cbind(post_beta0, post_beta1, post_beta2))
predMu <- cbind(1, as.matrix(predCoords_sc)) %*% t(cbind(post_beta0, post_beta1, post_beta2))
pred2obsDist <- fields::rdist(predCoords, obsCoords)
Rcpp::sourceCpp("functions/prediction_marginal_gp12.cpp")
args(prediction_marginal_gp12)## function (y, obsMu, predMu, obsDistMat, pred2ObsDistMat, sigmasq,
## phi, tausq, iterprint)
## NULLsystem.time(
pred_samples <- prediction_marginal_gp12(
y = Mtl_benzene_sample$y,
obsMu = obsMu,
predMu = predMu,
obsDistMat = obsDist,
pred2ObsDistMat = pred2obsDist,
sigmasq = post_sigmasq,
phi = post_phi,
tausq = post_tausq,
iterprint = 1000
)
)## Prediction upto the 0th MCMC sample is completed
## Prediction upto the 1000th MCMC sample is completed
## Prediction upto the 2000th MCMC sample is completed## user system elapsed
## 149.52 0.09 178.07predict_res_dt <- data.frame(
xcoord = predCoords[, 1],
ycoord = predCoords[, 2],
post.mean = apply(pred_samples, 1, mean),
post.var = apply(pred_samples, 1, var),
q2.5 = apply(pred_samples, 1, function(x)
quantile(x, prob = 0.025)),
q50 = apply(pred_samples, 1, function(x)
quantile(x, prob = 0.5)),
q97.5 = apply(pred_samples, 1, function(x)
quantile(x, prob = 0.975))
)x$nimble.pred <- predict_res_dt$post.mean
x$nimble.var <- predict_res_dt$post.var
nimble_pred <-
spplot (
x["nimble.pred"],
main = "Nimble spatial predictions ",
col.regions = viridis::plasma(60),
sp.layout = list(monitor_loc),
at = seq(-0.3, 0.8, 0.02)
)
nimble_var <-
spplot (
x["nimble.var"],
main = "Nimble predictions variance ",
col.regions = viridis::plasma(60),
sp.layout = list(monitor_loc),
at = seq(0, 0.2, 0.01)
)
plot_grid(nimble_pred, nimble_var, labels = "auto")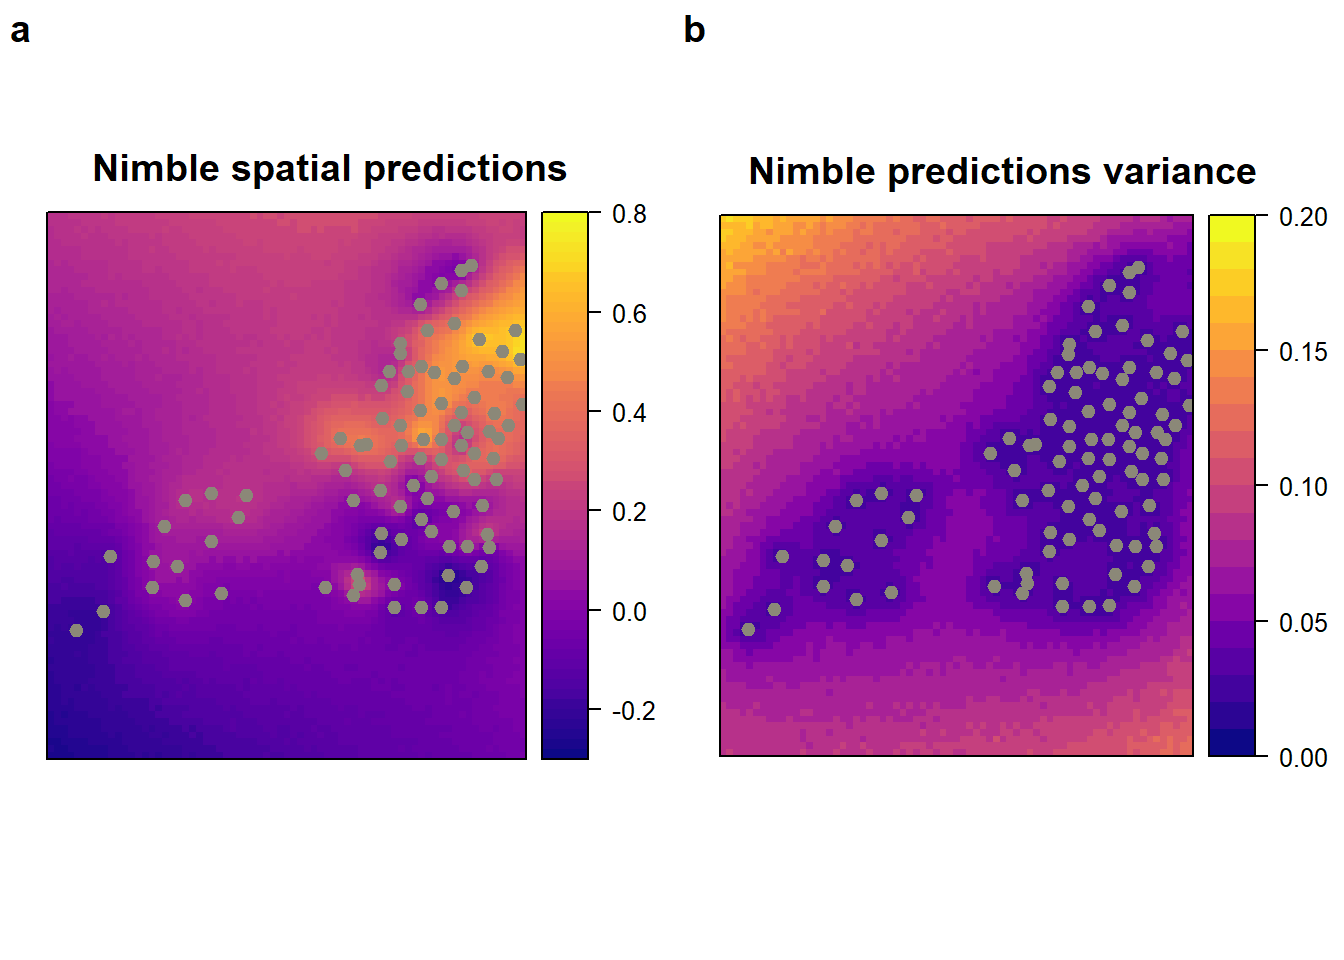
## [1] -0.2748897 -0.2610339 -0.2629892 -0.2617884 -0.2446157## [1] 0.08898525 0.09035693 0.08581058 0.08874131 0.08585555Stan
benzene_data <- read.csv("data/voc/montreal_benzene_apr.csv")
# create a new variable in "sp" format and define coordinates
benzene_data_geo <- benzene_data
coordinates(benzene_data_geo) <- ~ lon + lat
proj4string(benzene_data_geo) <- CRS("+proj=longlat +datum=WGS84")
benzene_data_utm <- spTransform(benzene_data_geo,
CRS("+proj=utm +zone=18 +ellps=WGS72"))
# Save the utm as a data frame
benzene_utm_df <- as.data.frame(benzene_data_utm)
# change the observed values to the log scale and the coordinates to km's
Mtl_benzene_sample <-
data.frame(
y = log(benzene_utm_df$Benzene),
easting = benzene_utm_df$lon / 1000,
northing = benzene_utm_df$lat / 1000
)
# Compute the distance matrix
obsCoords <- unname(as.matrix(Mtl_benzene_sample[,c("easting", "northing")]))
obsDist <- fields::rdist(obsCoords)
data {
int<lower=1> N;
int<lower=0> p;
vector[N] y;
matrix[N,N] dist_matrix;
matrix[N,p] X;
}
parameters {
real<lower=0> phi;
real<lower=0> tau;
real<lower=0> sigma;
vector[p] beta;
real beta0;
}
transformed parameters{
real<lower=0> sigma_sq = square(sigma);
real<lower=0> tau_sq = square(tau);
}
model {
vector[N] mu;
matrix[N, N] L;
matrix[N, N] Sigma;
Sigma = sigma_sq * exp(-dist_matrix/ phi) + tau_sq *diag_matrix(rep_vector(1, N));
for(i in 1:N) {
mu[i] = beta0 + X[i,]*beta;
}
L = cholesky_decompose(Sigma);
beta0 ~ normal(0,10);
beta ~ normal(0,10);
phi ~ inv_gamma(5, 5);
tau ~ cauchy(0,1);
sigma ~ cauchy(0,1);
y ~ multi_normal_cholesky(mu, L);
}set.seed(1)
easting_scaled <- as.vector(scale(Mtl_benzene_sample$easting))
northing_scaled <- as.vector(scale(Mtl_benzene_sample$northing))
N <- nrow(benzene_utm_df)
# Change coordinates to kilometers
X <- data.frame(easting = easting_scaled,
northing = northing_scaled)
ex.data <- list(
N = N,
p = 2,
y = log(benzene_utm_df$Benzene),
dist_matrix = obsDist,
X = as.matrix(X)
)
Example10_9Stan <- stan(
file = "functions/Example10_9.stan",
data = ex.data,
warmup = 10000,
iter = 20000,
chains = 2,
thin = 10,
pars = c("beta0", "beta", "sigma_sq", "tau_sq", "phi"),
include = TRUE
)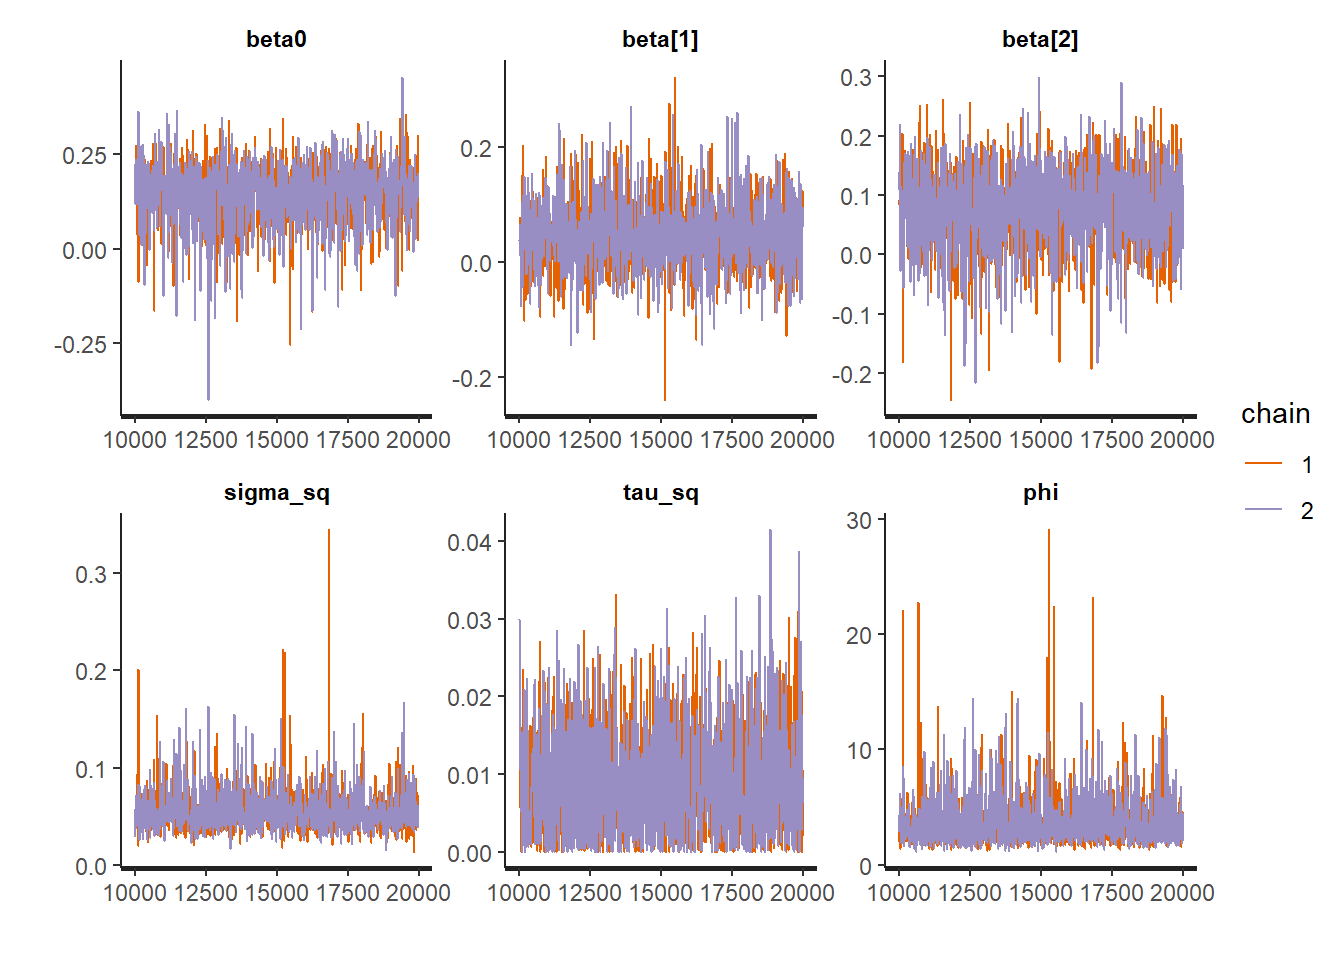
summary_exp_stan <-
summary(
Example10_9Stan,
pars = c("beta0","beta", "sigma_sq", "tau_sq", "phi"),
probs = c(0.025, 0.975)
)
summary_exp_stan$summary## mean se_mean sd 2.5% 97.5% n_eff
## beta0 0.146457291 0.0018562983 0.07997902 -3.023587e-02 0.28132110 1856.336
## beta[1] 0.047496231 0.0013261678 0.05957233 -6.496270e-02 0.17626742 2017.866
## beta[2] 0.080290249 0.0014607308 0.06744570 -5.992676e-02 0.19665262 2131.906
## sigma_sq 0.055772229 0.0004686651 0.02109726 2.831741e-02 0.10389363 2026.408
## tau_sq 0.009142795 0.0001523047 0.00674511 6.533636e-05 0.02383244 1961.335
## phi 3.666760755 0.0513903964 2.24757184 1.501948e+00 9.25712051 1912.772
## Rhat
## beta0 0.9994055
## beta[1] 0.9991897
## beta[2] 0.9993034
## sigma_sq 1.0000657
## tau_sq 1.0016241
## phi 0.9994019# Obtain coordinates for predictions
# note that we are using the same coordinates as the one generated for
# the kriging example
Mtl_centroids_df <- as.data.frame(MtlPred)
predCoords <- unname(as.matrix(Mtl_centroids_df))# Extract samples from nimble model
stan_post_samples <- rstan::extract(Example10_9Stan,
pars = c("beta0","beta", "phi", "sigma_sq", "tau_sq"))
# Extract posterior samples for each of the parameters of interest
post_beta0 <- stan_post_samples$beta0
post_beta <- stan_post_samples$beta
# post_beta2 <- stan_post_samples$beta2
post_sigmasq <- stan_post_samples$sigma_sq
post_phi <- stan_post_samples$phi
post_tausq <- stan_post_samples$tau_sq
# Scale coordinates for predictive locations
predCoords_sc <- predCoords
predCoords_sc[,1] <-
(predCoords_sc[,1] - mean(Mtl_benzene_sample$easting)) / sd(Mtl_benzene_sample$easting)
predCoords_sc[,2] <-
(predCoords_sc[,2] - mean(Mtl_benzene_sample$northing)) / sd(Mtl_benzene_sample$northing)
n0 <- nrow(predCoords_sc)
L <- length(post_tausq)
obsMu <- cbind(1, easting_scaled, northing_scaled) %*% t(cbind(post_beta0, post_beta))
predMu <- cbind(1, as.matrix(predCoords_sc)) %*% t(cbind(post_beta0, post_beta))
pred2obsDist <- fields::rdist(predCoords, obsCoords)
Rcpp::sourceCpp("functions/prediction_marginal_gp12.cpp")
args(prediction_marginal_gp12)## function (y, obsMu, predMu, obsDistMat, pred2ObsDistMat, sigmasq,
## phi, tausq, iterprint)
## NULLsystem.time(
pred_samples <- prediction_marginal_gp12(
y = Mtl_benzene_sample$y,
obsMu = obsMu,
predMu = predMu,
obsDistMat = obsDist,
pred2ObsDistMat = pred2obsDist,
sigmasq = post_sigmasq,
phi = post_phi,
tausq = post_tausq,
iterprint = 1000
)
)## Prediction upto the 0th MCMC sample is completed
## Prediction upto the 1000th MCMC sample is completed## user system elapsed
## 107.44 0.09 126.70predict_res_dt <- data.frame(
xcoord = predCoords[, 1],
ycoord = predCoords[, 2],
post.mean = apply(pred_samples, 1, mean),
post.var = apply(pred_samples, 1, var),
q2.5 = apply(pred_samples, 1, function(x)
quantile(x, prob = 0.025)),
q50 = apply(pred_samples, 1, function(x)
quantile(x, prob = 0.5)),
q97.5 = apply(pred_samples, 1, function(x)
quantile(x, prob = 0.975))
)x$stan.pred <- predict_res_dt$post.mean
x$stan.var <- predict_res_dt$post.var
stan_pred <-
spplot (
x["stan.pred"],
main = "Stan spatial predictions ",
col.regions = viridis::plasma(60),
sp.layout = list(monitor_loc),
at = seq(-0.3, 0.8, 0.02)
)
stan_var <-
spplot (
x["stan.var"],
main = "Stan predictions variance ",
col.regions = viridis::plasma(60),
sp.layout = list(monitor_loc),
at = seq(0, 0.2, 0.01)
)
plot_grid(stan_pred, stan_var, labels = "auto")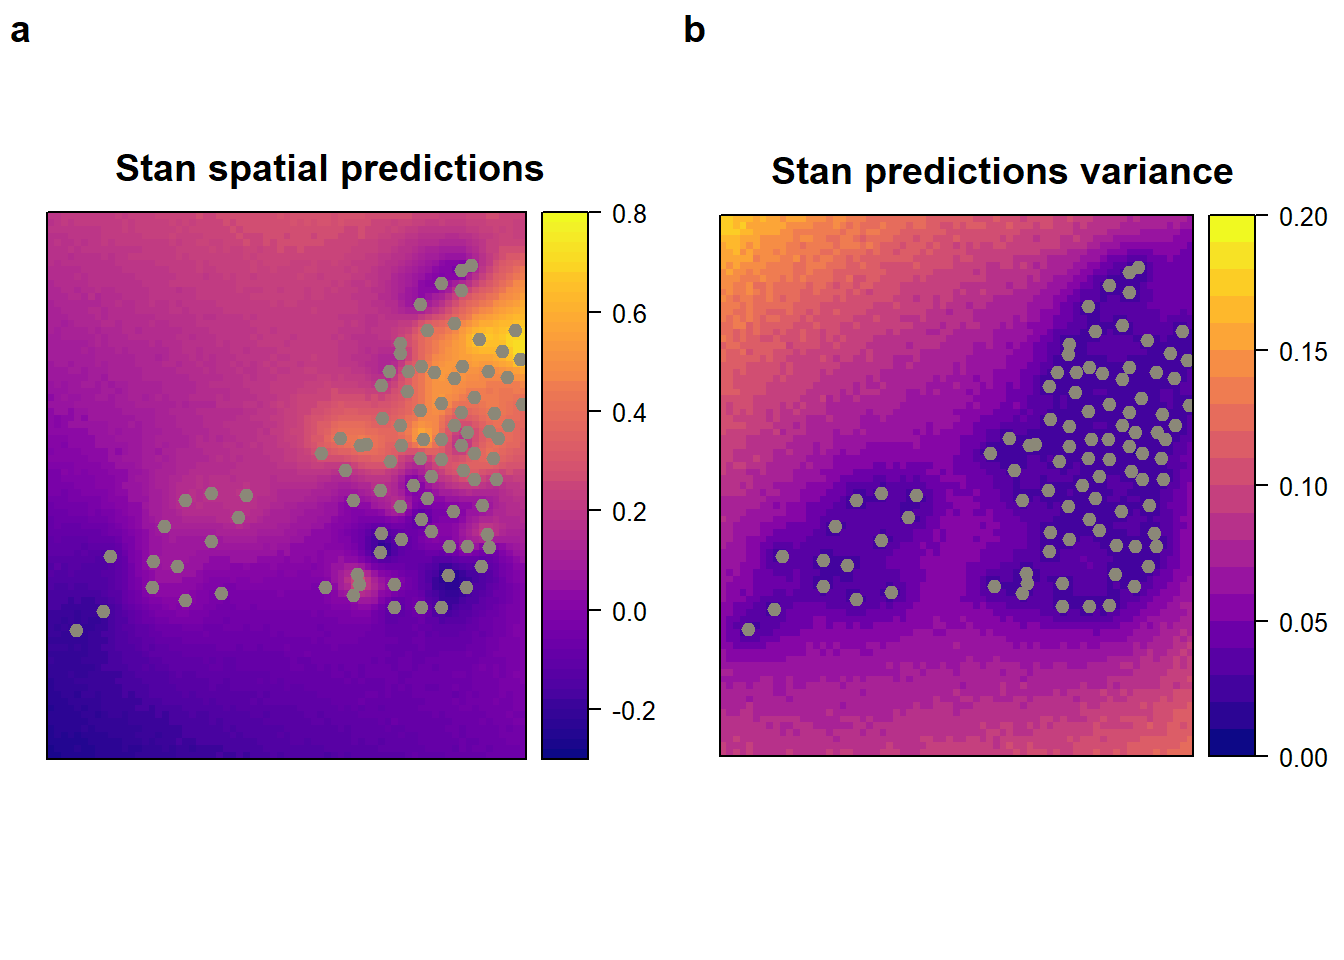
Extra 10.9: Spatial predictions
Nimble
# NOTE: I am just doing for 5 locations (please double-check my equations) and it instead of running in 2 minutes it runs in 6 (in case you want to highlight that). But we should discuss the order of this cause I am doing the predictions with Paritosh's code in the previous section.
# Obtain coordinates for predictions
# note that we are using the same coordinates as the one generated for
# the kriging example
Mtl_centroids_df <- as.data.frame(MtlPred)
predCoords <- unname(as.matrix(Mtl_centroids_df))
# Scale coordinates for predictive locations
predCoords_sc <- predCoords
predCoords_sc[,1] <-
(predCoords_sc[,1] - mean(Mtl_benzene_sample$easting)) / sd(Mtl_benzene_sample$easting)
predCoords_sc[,2] <-
(predCoords_sc[,2] - mean(Mtl_benzene_sample$northing)) / sd(Mtl_benzene_sample$northing)
# As an example we are only going to predict 5 locations
nu <- 5
predCoords_five <- predCoords_sc[1:nu,]
obs2predDist <- fields::rdist(obsCoords, predCoords[1:nu,])
pred2predDist <- fields::rdist(predCoords[1:nu,])Example10_10Code <- nimbleCode ({
# Covariance matrix spatial effect
Sigma_obs[1:n, 1:n] <-
sigma_sq * exp(-distMatrix[1:n, 1:n] / phi) + tau_sq * identityMatrix(d = n)
Sigma_pred[1:nu, 1:nu] <-
sigma_sq * exp(-distMatrixUnobs[1:nu, 1:nu] / phi) + tau_sq * identityMatrix(d = nu)
Sigma_obs_pred[1:n, 1:nu] <-
sigma_sq * exp(-distMatrixObsUnobs[1:n, 1:nu] / phi)
for (site in 1:n) {
mean.site[site] <-
beta0 + beta1 * easting[site] + beta2 * northing[site]
}
y[1:n] ~ dmnorm(mean.site[1:n], cov = Sigma_obs[1:n, 1:n])
# Spatial predictions
for (usite in 1:nu) {
mean.pred.site[usite] <-
beta0 + beta1 * easting_pred[usite] + beta2 * northing_pred[usite]
}
mean_sigma[1:nu] <- t(Sigma_obs_pred[1:n, 1:nu])%*%
inverse(Sigma_obs[1:n, 1:n])%*%(y[1:n] - mean.site[1:n])
mu_pred[1:nu] <-
mean.pred.site[1:nu] + mean_sigma[1:nu]
cov_pred[1:nu, 1:nu] <-
Sigma_pred[1:nu, 1:nu] - t(Sigma_obs_pred[1:n, 1:nu]) %*% inverse(Sigma_obs[1:n, 1:n]) %*% Sigma_obs_pred[1:n, 1:nu]
y_pred[1:nu] ~ dmnorm(mu_pred[1:nu], cov = cov_pred[1:nu, 1:nu])
# Set up the priors for the spatial model
sigma ~ T(dt(mu = 0, sigma = 1, df = 1), 0, Inf)
sigma_sq <- sigma ^ 2
tau ~ T(dt(mu = 0, sigma = 1, df = 1), 0, Inf)
tau_sq <- tau ^ 2
phi_inv ~ dgamma(shape = 5, rate = 5)
phi <- 1 / phi_inv
# prior for the coefficients
beta0 ~ dnorm (0, 10)
beta1 ~ dnorm (0, 10)
beta2 ~ dnorm (0, 10)
})
# Define the constants, data, parameters and initial values
set.seed(1)
easting_scaled <- as.vector(scale(Mtl_benzene_sample$easting))
northing_scaled <- as.vector(scale(Mtl_benzene_sample$northing))
constants <-
list(n = nrow(Mtl_benzene_sample), nu = nu)
ex.data <-
list(
y = Mtl_benzene_sample$y,
easting = easting_scaled,
northing = northing_scaled,
easting_pred = predCoords_five[,1],
northing_pred = predCoords_five[,2],
distMatrix = obsDist,
distMatrixUnobs = pred2predDist,
distMatrixObsUnobs = obs2predDist
)
params <-
c("beta0",
"beta1",
"beta2",
"phi",
"tau",
"sigma",
"tau_sq",
"y_pred",
"sigma_sq")
inits <- list(sigma = 0.1,
phi_inv = 6 / max(obsDist),
tau = 0.1)
# Run model in nimble
mcmc.out <- nimbleMCMC(
code = Example10_10Code,
constants = constants,
data = ex.data,
inits = inits,
monitors = params,
niter = 40000,
nburnin = 20000,
thin = 14,
WAIC = TRUE,
nchains = 2,
summary = TRUE,
samplesAsCodaMCMC = TRUE
)## nimbleList object of type waicList
## Field "WAIC":
## [1] -32.28445
## Field "lppd":
## [1] 19.03747
## Field "pWAIC":
## [1] 2.895244## [1] 849.3096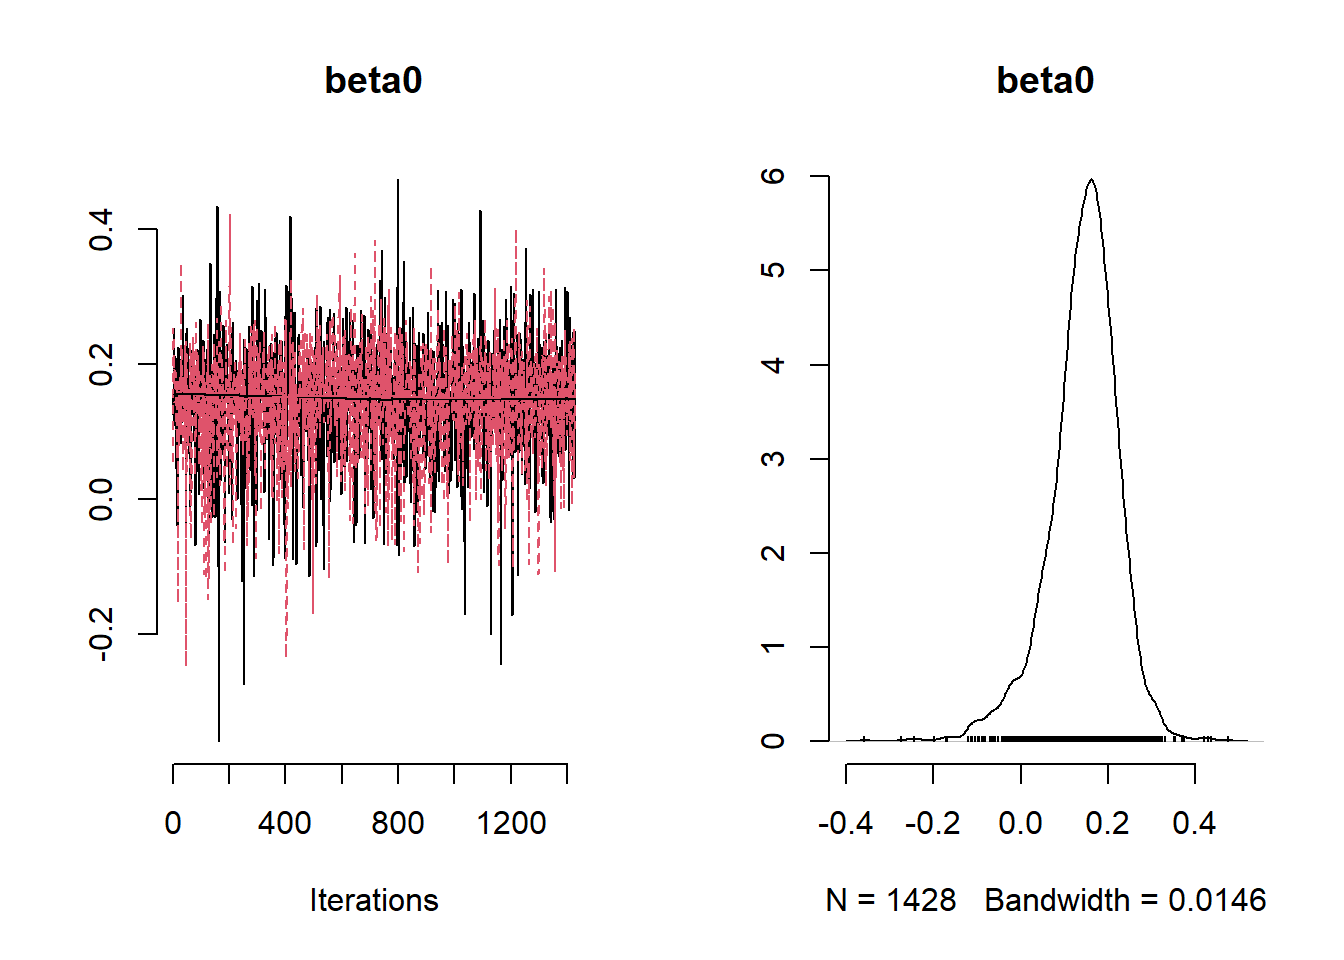
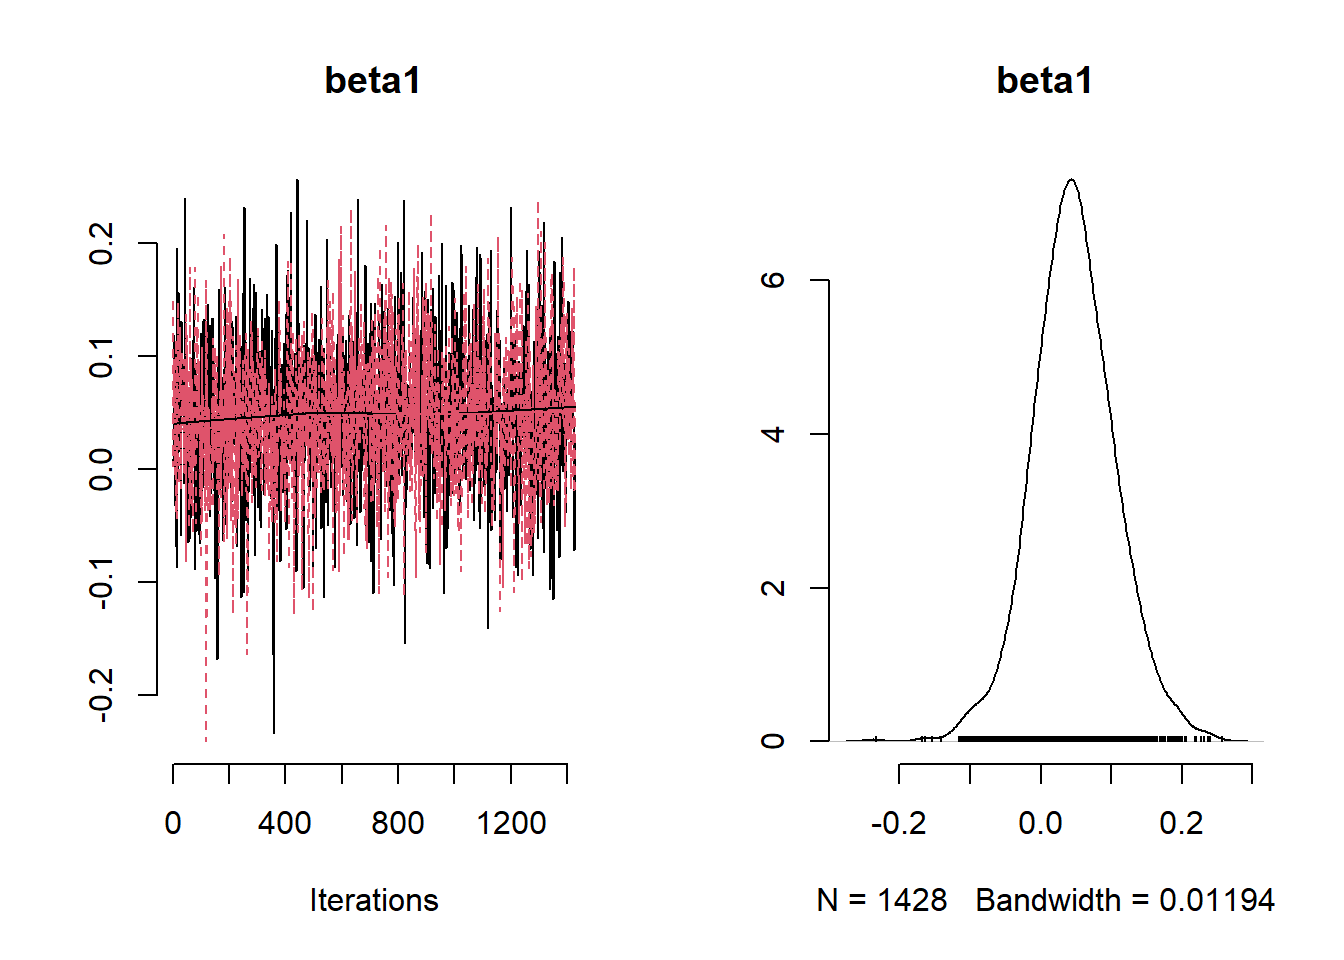
## Mean Median St.Dev. 95%CI_low 95%CI_upp
## beta0 0.143282027 0.151098526 0.080210901 -4.320255e-02 0.28188251
## beta1 0.047132468 0.045714893 0.059074146 -7.036740e-02 0.16808769
## beta2 0.078236153 0.083129502 0.067977770 -6.927811e-02 0.19791770
## phi 3.672082520 3.089047660 2.158752561 1.484596e+00 9.20444422
## sigma 0.233174608 0.227937419 0.040783337 1.687427e-01 0.33073631
## sigma_sq 0.056033096 0.051955467 0.021212336 2.847411e-02 0.10938656
## tau 0.086925465 0.091948800 0.039612987 5.328545e-03 0.15319110
## tau_sq 0.009124676 0.008454582 0.006622246 2.839674e-05 0.02346751
## y_pred[1] -0.255307410 -0.262034854 0.307921711 -8.442072e-01 0.36678929
## y_pred[2] -0.255612451 -0.263067874 0.306518102 -8.718905e-01 0.36502437
## y_pred[3] -0.247526801 -0.251652153 0.299628925 -8.238475e-01 0.37022723
## y_pred[4] -0.248606948 -0.257696742 0.303087157 -8.451291e-01 0.37558929
## y_pred[5] -0.246847841 -0.246510211 0.301927586 -8.437388e-01 0.35702082Stan
# Load data predictions
# Obtain coordinates for predictions
# note that we are using the same coordinates as the one generated for
# the kriging example
Mtl_centroids_df <- as.data.frame(MtlPred)
predCoords <- unname(as.matrix(Mtl_centroids_df))
# Scale coordinates for predictive locations
predCoords_sc <- predCoords
predCoords_sc[,1] <-
(predCoords_sc[,1] - mean(Mtl_benzene_sample$easting)) / sd(Mtl_benzene_sample$easting)
predCoords_sc[,2] <-
(predCoords_sc[,2] - mean(Mtl_benzene_sample$northing)) / sd(Mtl_benzene_sample$northing)
# As an example we are only going to predict 5 locations
nu <- 5
predCoords_five <- predCoords_sc[1:nu,]
obs2predDist <- fields::rdist(obsCoords, predCoords[1:nu,])
pred2predDist <- fields::rdist(predCoords[1:nu,])data {
int<lower=1> N;
int<lower = 0> N_pred;
int<lower=0> p;
vector[N] y;
matrix[N,N] obs_dist_matrix;
matrix[N,N_pred] obs_pred_dist_matrix;
matrix[N_pred, N_pred] pred_dist_matrix;
matrix[N,p] X;
matrix[N_pred,p] X_pred;
}
parameters {
real<lower=0> phi;
real<lower=0> tau;
real<lower=0> sigma;
vector[p] beta;
real beta0;
}
transformed parameters{
real<lower=0> sigma_sq = square(sigma);
real<lower=0> tau_sq = square(tau);
}
model {
matrix[N, N] L;
matrix[N, N] Sigma;
vector[N] mu;
Sigma = sigma_sq * exp(-obs_dist_matrix/ phi) + tau_sq *diag_matrix(rep_vector(1, N));
// diagonal elements
for(i in 1:N) {
mu[i] = beta0 + X[i,]*beta;
}
L = cholesky_decompose(Sigma);
beta0 ~ normal(0,10);
beta ~ normal(0,10);
phi ~ inv_gamma(5, 5);
tau ~ cauchy(0,1);
sigma ~ cauchy(0,1);
y ~ multi_normal_cholesky(mu, L);
}
generated quantities {
matrix[N_pred, N_pred] L;
matrix[N, N] Sigma_obs;
matrix[N_pred, N_pred] Sigma_pred;
matrix[N_pred, N_pred] Cov_pred;
matrix[N, N_pred] Sigma_obs_pred;
vector[N] mu;
vector[N_pred] mu_unobs;
vector[N_pred] mu_pred;
vector[N_pred] y_pred;
Sigma_obs = sigma_sq * exp(-obs_dist_matrix/ phi) + tau_sq *diag_matrix(rep_vector(1, N));
Sigma_pred = sigma_sq * exp(-pred_dist_matrix/ phi) + tau_sq *diag_matrix(rep_vector(1, N_pred));
Sigma_obs_pred = sigma_sq * exp(-obs_pred_dist_matrix/ phi);
for (j in 1:N_pred) {
mu_unobs[j] = beta0 + X_pred[j,]*beta;
}
for(i in 1:N) {
mu[i] = beta0 + X[i,]*beta;
}
mu_pred = mu_unobs + Sigma_obs_pred'*inverse(Sigma_obs)*(y - mu);
Cov_pred = Sigma_pred - Sigma_obs_pred'*inverse(Sigma_obs)*Sigma_obs_pred;
L = cholesky_decompose(Cov_pred);
y_pred = multi_normal_cholesky_rng(mu_pred, L);
}set.seed(1)
easting_scaled <- as.vector(scale(Mtl_benzene_sample$easting))
northing_scaled <- as.vector(scale(Mtl_benzene_sample$northing))
N <- nrow(benzene_utm_df)
# Change coordinates to kilometers
X <- data.frame(easting = easting_scaled,
northing = northing_scaled)
ex.data <- list(
N = N,
N_pred = nrow(predCoords_five),
p = 2,
y = log(benzene_utm_df$Benzene),
obs_dist_matrix = obsDist,
obs_pred_dist_matrix = obs2predDist,
pred_dist_matrix = pred2predDist,
X = as.matrix(X),
X_pred = predCoords_five
)
Example10_10Stan <- stan(
file = "functions/Example10_10.stan",
data = ex.data,
warmup = 10000,
iter = 20000,
chains = 2,
thin = 10,
pars = c("beta0", "beta", "sigma_sq", "tau_sq", "phi", "y_pred"),
include = TRUE
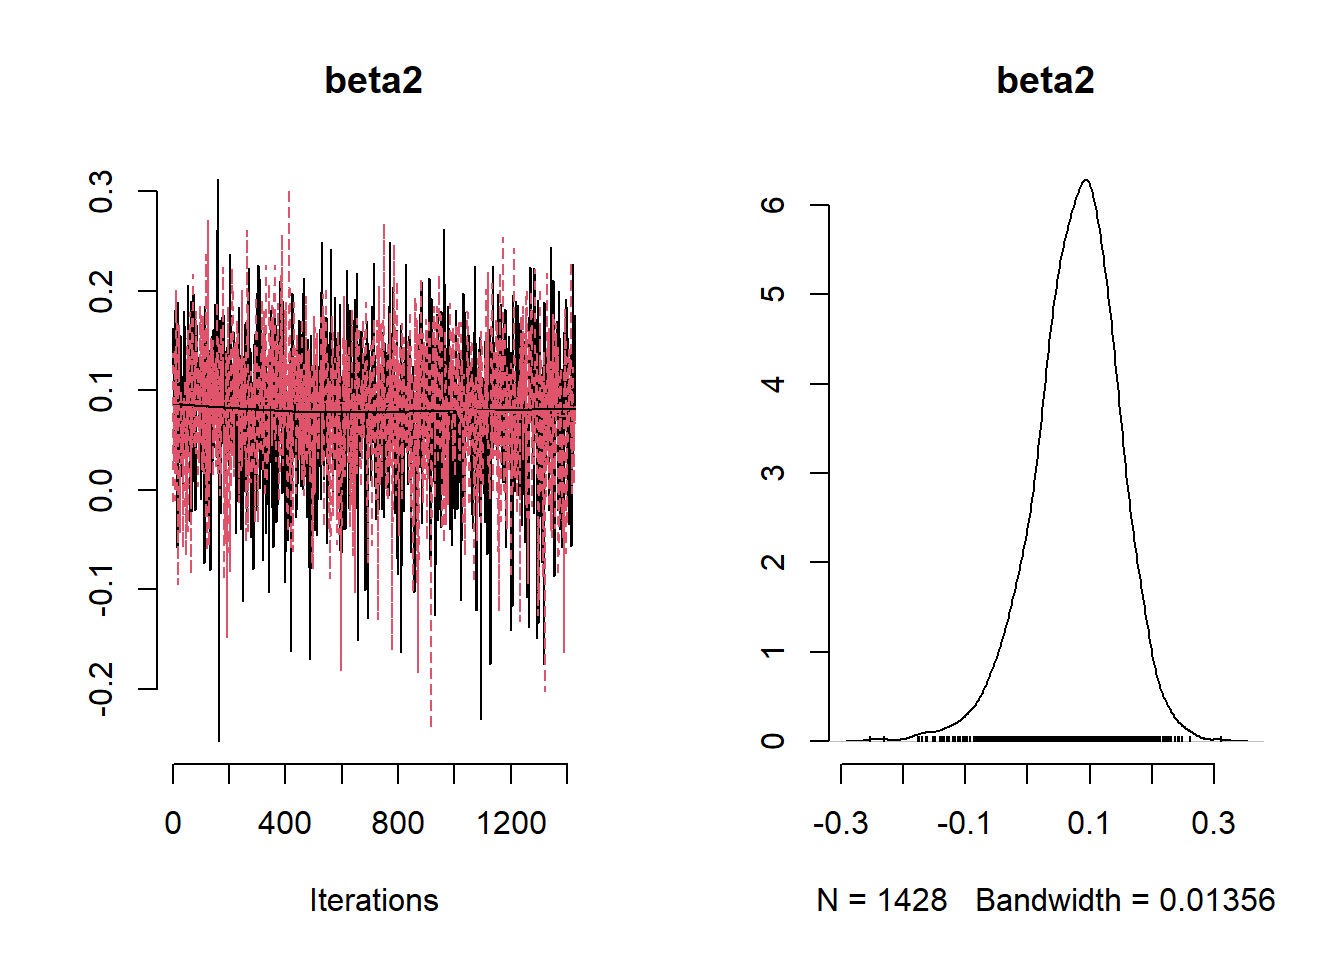
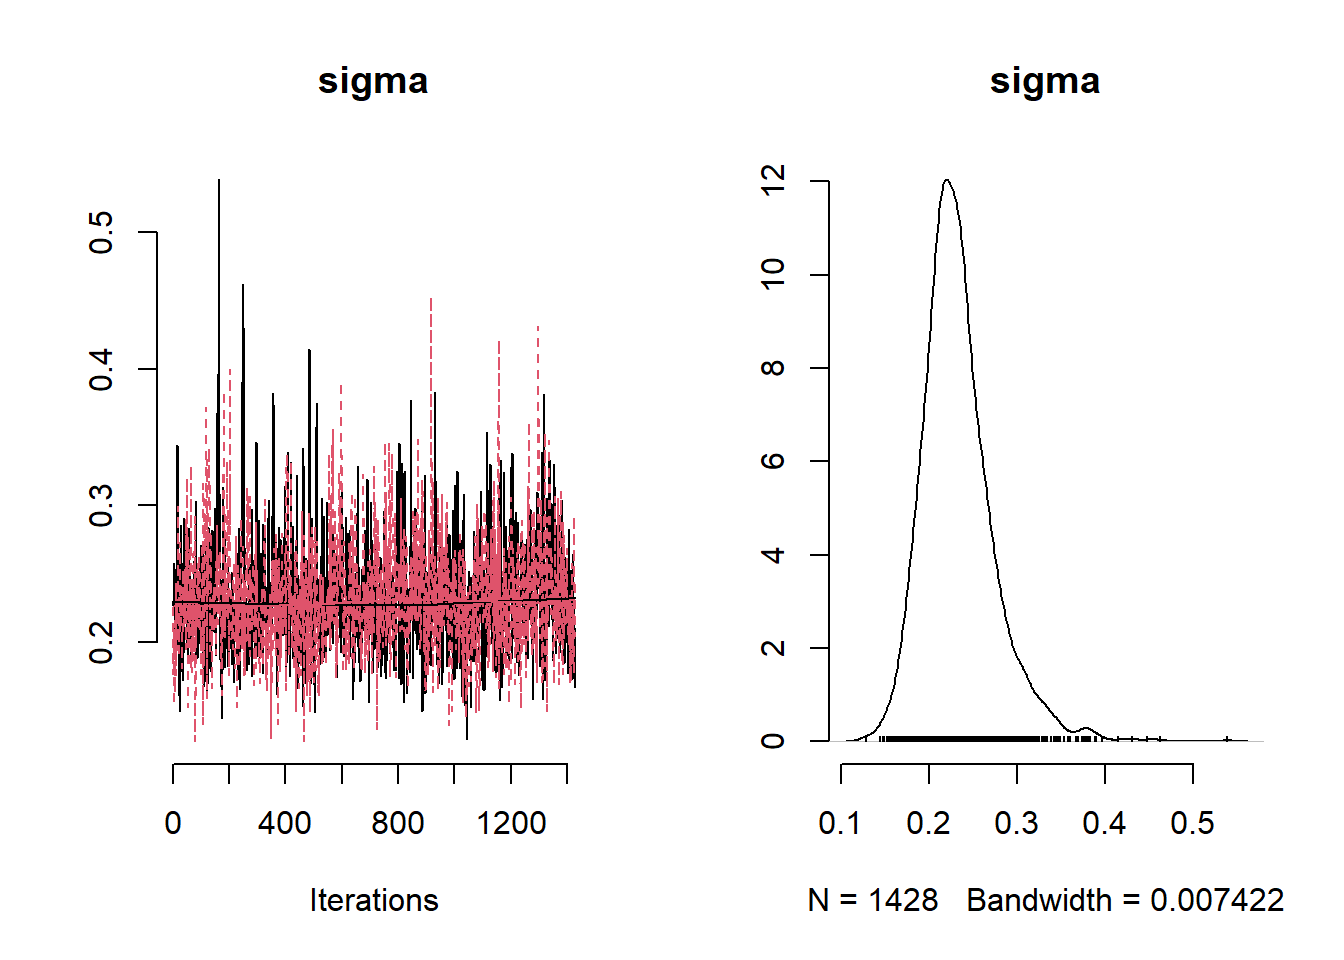
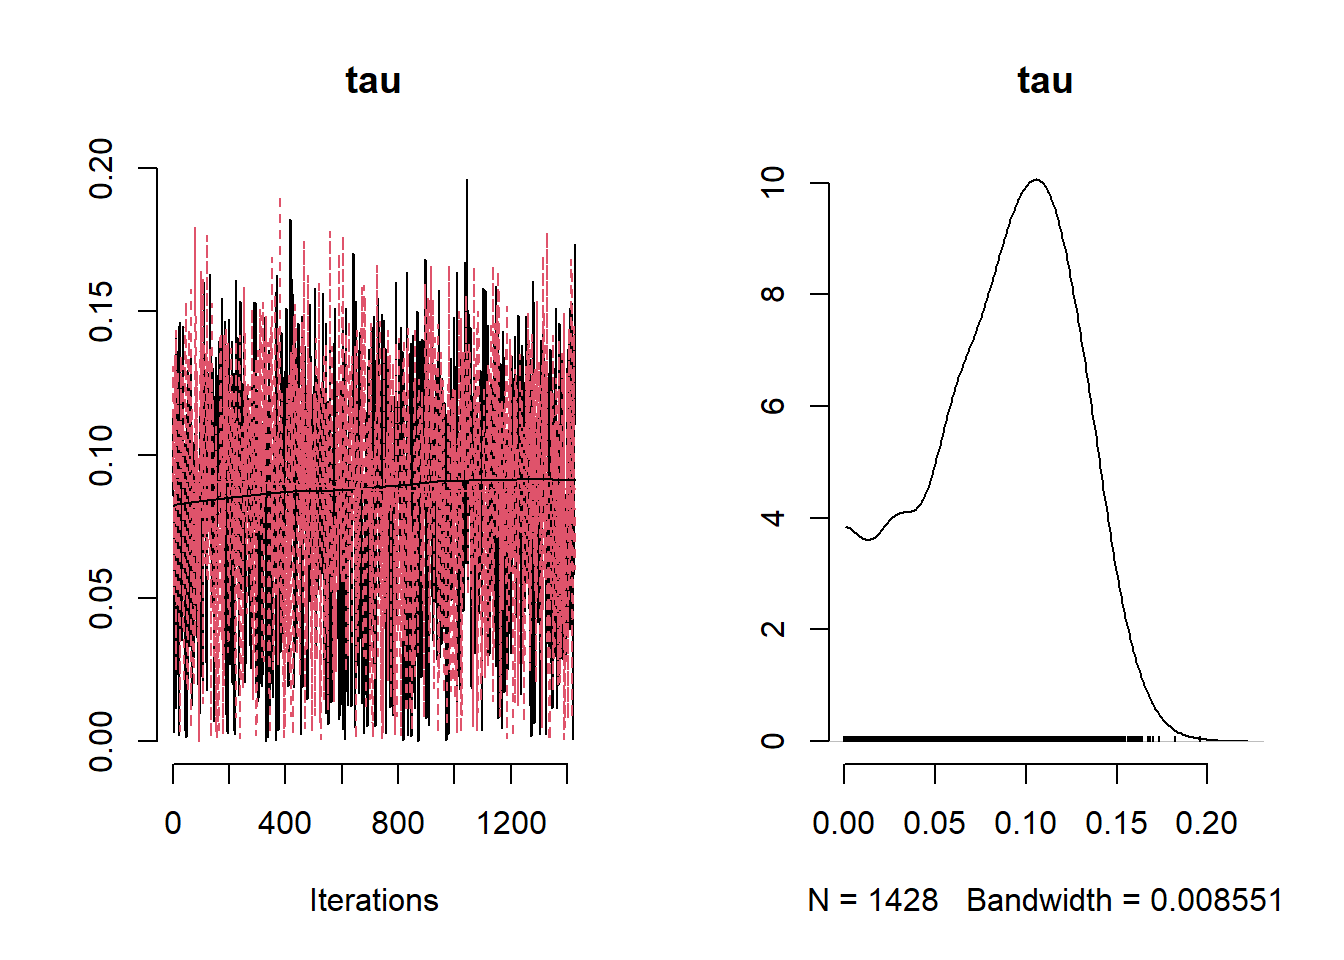
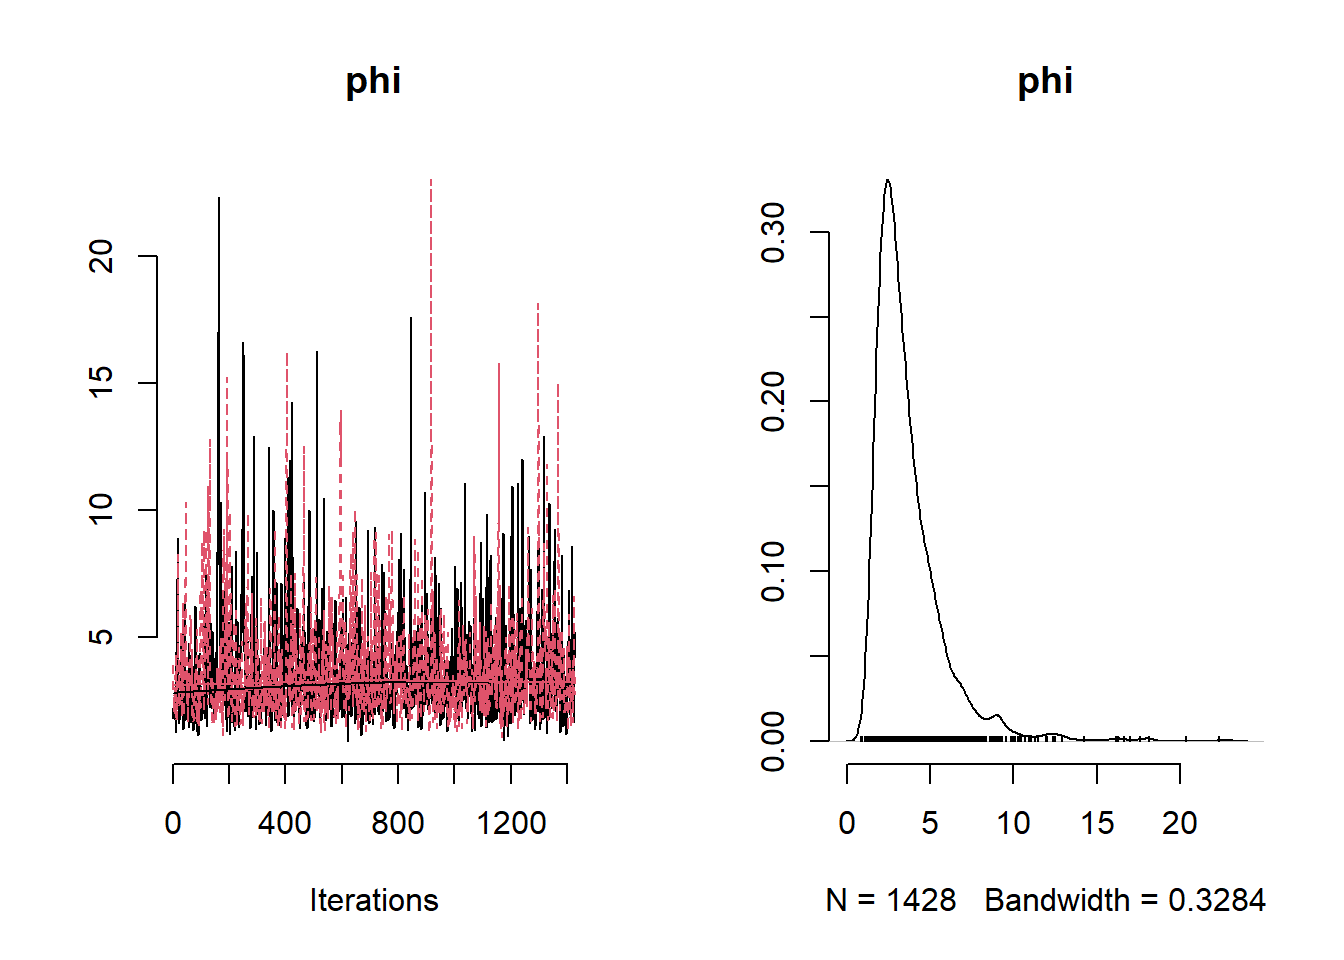
)rstan::traceplot(Example10_10Stan, pars = c("beta0","beta","sigma_sq", "tau_sq", "phi", "y_pred[1]", "y_pred[5]"))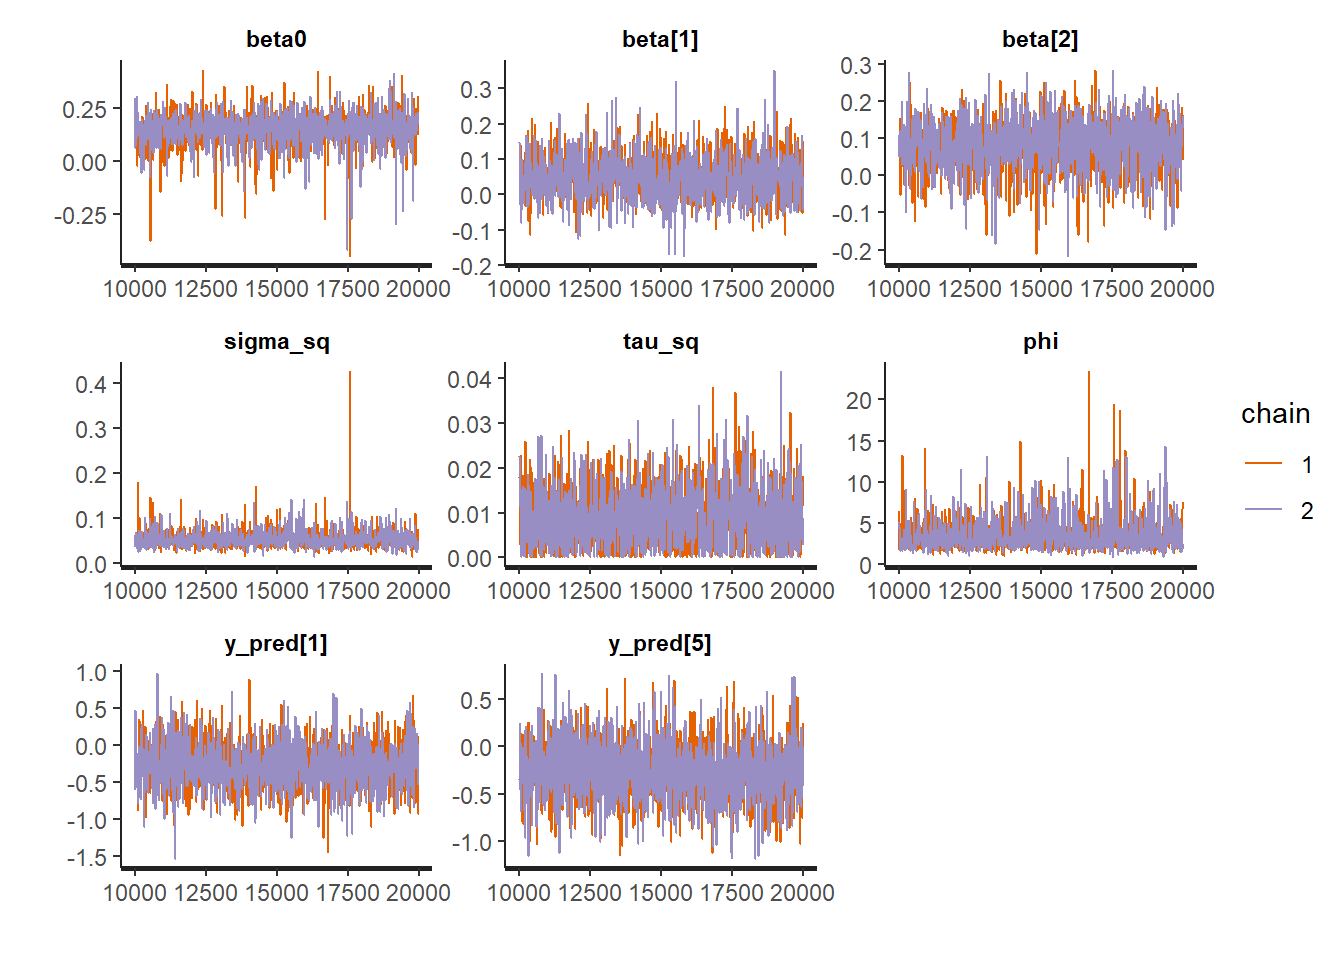
summary_exp_stan <-
  summary(
    Example10_10Stan,
    pars = c("beta0","beta", "sigma_sq", "tau_sq",  "phi", "y_pred"),
    probs = c(0.025, 0.975)
  )

summary_exp_stan$summary
## mean se_mean sd 2.5% 97.5%
## beta0 0.15258643 0.0018234279 0.079308240 -2.001743e-02 0.28617872
## beta[1] 0.05045002 0.0014848444 0.060158681 -5.797474e-02 0.17469632
## beta[2] 0.08097296 0.0015480754 0.068716147 -6.234031e-02 0.19892439
## sigma_sq 0.05490898 0.0004512223 0.019765362 2.856358e-02 0.09963885
## tau_sq 0.00908246 0.0001454411 0.006536201 7.628813e-05 0.02330783
## phi 3.53683130 0.0439541748 1.944669225 1.459591e+00 8.51153142
## y_pred[1] -0.27171824 0.0064573238 0.301755582 -8.662022e-01 0.32660398
## y_pred[2] -0.27014241 0.0062501053 0.298996379 -8.465919e-01 0.34943459
## y_pred[3] -0.27137893 0.0065656694 0.304186203 -8.428175e-01 0.36845440
## y_pred[4] -0.26958521 0.0066000702 0.301509144 -8.596208e-01 0.33281974
## y_pred[5] -0.26371260 0.0065379338 0.304303176 -8.687426e-01 0.37264053
## n_eff Rhat
## beta0 1891.731 1.0012130
## beta[1] 1641.477 1.0027991
## beta[2] 1970.305 1.0025511
## sigma_sq 1918.794 0.9998376
## tau_sq 2019.653 1.0003639
## phi 1957.452 1.0003897
## y_pred[1] 2183.763 1.0000693
## y_pred[2] 2288.533 0.9998625
## y_pred[3] 2146.451 0.9993365
## y_pred[4] 2086.911 0.9999384
## y_pred[5] 2166.366 1.0000249Extra 10.10: INLA, creating a mesh
This example uses the montreal_benzene_apr.csv
library(geoR)
library(INLA)
library(spdep)

benzene_data <- read.csv("data/voc/montreal_benzene_apr.csv")
# create a new variable in "sp" format and define coordinates
benzene_data_loc <- benzene_data
coordinates(benzene_data_loc) <- ~ lon + lat
proj4string(benzene_data_loc) <- CRS("+proj=longlat +datum=WGS84")

benzene_data_utm <- spTransform(benzene_data_loc,
                        CRS("+proj=utm +zone=18 +ellps=WGS72"))
# Save the utm as a data frame
locations_df <- as.data.frame(benzene_data_utm@coords)

benzene_utm_df <- data.frame( ID = 1:nrow(benzene_data),
                              X = benzene_data_utm@coords[,1]/1000,
                              Y = benzene_data_utm@coords[,2]/1000,
                              logbenzene = log(benzene_data_utm$Benzene))

# change the observed values to the log scale and the coordinates to km's

mesh = inla.mesh.create(locations_df, cutoff = 0.01,
                       refine =(list(min.angle =20)))
plot(mesh , col="gray", main="") 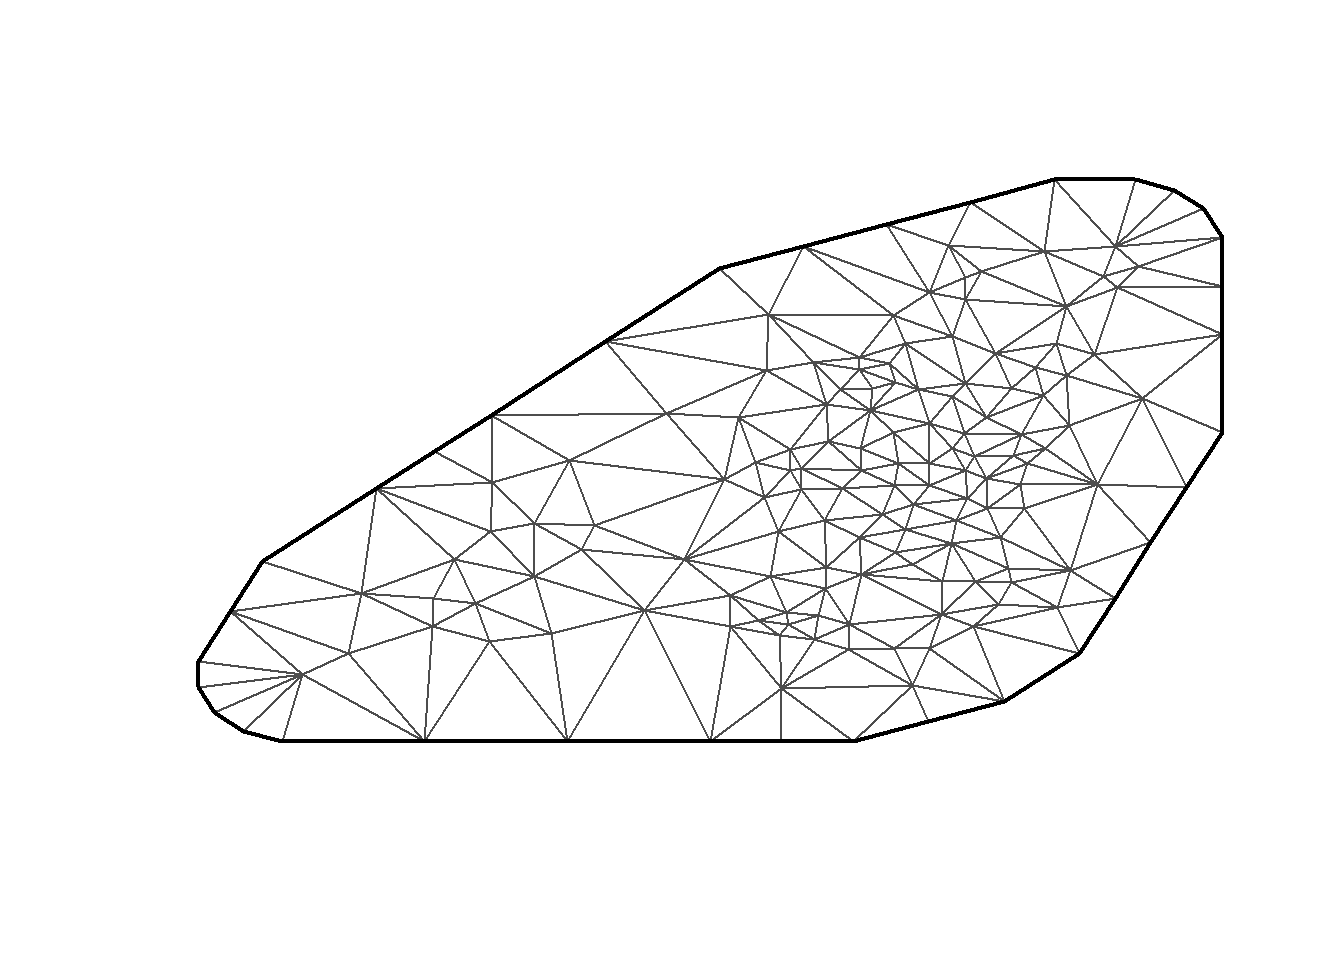
Extra 10.12: Fitting an SPDE model using R–INLA: benzene concentration in Montreal
# Field std . dev . for theta =0
sigma0 = 1
# find the range of the location data
size = min(c(diff(range(mesh$loc[, 1])),
             diff (range(mesh$loc[, 2]))))
# A fifth of the approximate domain width .
range0 = size/5
kappa0 = sqrt(8)/range0
tau0 = 1/(sqrt (4*pi)*kappa0*sigma0)
spde = inla.spde2.matern (
  mesh,
  B.tau = cbind(log (tau0), -1, +1),
  B.kappa = cbind(log (kappa0), 0, -1),
  theta.prior.mean = c(0 , 0),
  constr = TRUE
)

formula = logbenzene  ~ 1 + X + Y + f(ID , model = spde)
model = inla(
  formula,
  family = "gaussian",
  data = benzene_utm_df ,
  control.predictor = list(compute = TRUE),
  control.compute = list(dic = TRUE , config = TRUE)
)

model$summary.fixed
## mean sd 0.025quant 0.5quant 0.975quant
## (Intercept) 8.263245418 118.01725386 -189.26676108 -5.472126510 298.73628481
## X 0.014532837 0.02130264 -0.02563712 0.013291090 0.06340346
## Y -0.003363593 0.02371938 -0.06108402 -0.000648258 0.03642512
## mode kld
## (Intercept) -20.057233541 5.350248e-05
## X 0.011915234 7.754876e-05
## Y 0.002407345 3.418529e-05